
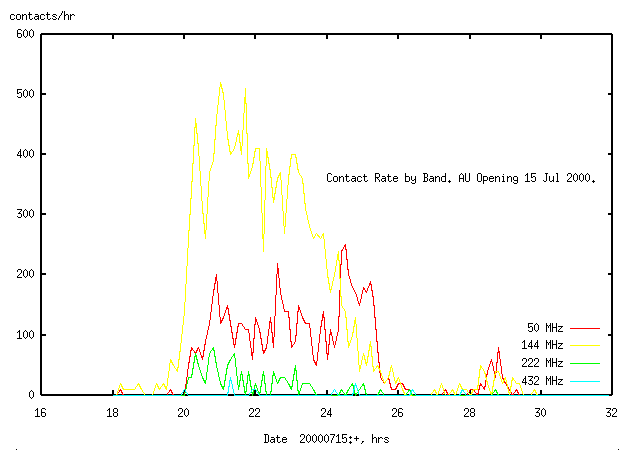
Here's the contact rate by band again. It shows an abrupt start at 1930UTC on 2m followed by an abrupt start of activity on 6m and 222MHz at 2000UTC. After 2hrs, activity declines on 2m and 222MHz, but continues on 6m. At 0000UTC on 16Jul there is a burst of activity for 2hrs on 6m. Later at 0500UTC there is another small opening.
It's difficult to tell whether activity on the different
bands is correlated from this sort of plot. The usual
way to correlate activity is to plot activity on 2 bands on 2 axes and to
see if they form a straight line. Since we have 3 bands with
enough information to plot, we do it on a 3-D graph,
with each axis having the activity for a band.
If activity on the 3 bands was correlated then the line
would start at the origin, go out to positive values for the 3 bands,
and then return to the origin at the end of the opening.
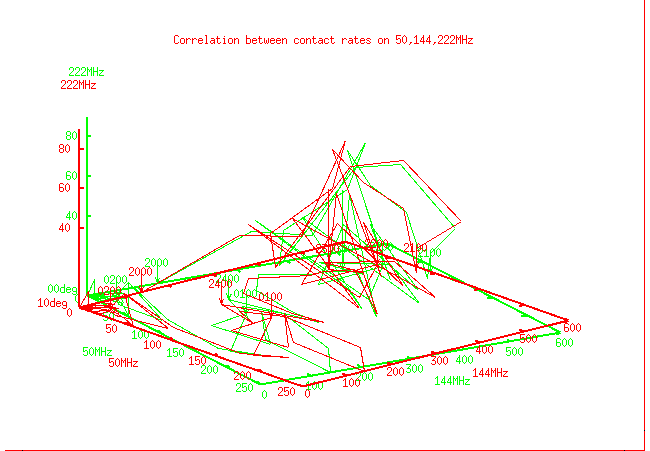
Here's the data for 50,144 and 222MHz.
for people with red (right) and green (left) stereo glasses:
for people who can infer 3-D by watching rotating 2-D projections:
Contacts start first on 2m, so the point describing the activity on the
3 bands moves up the 144MHz axis at 2000UTC.
Then the curve takes +ve values for all 3 bands, moving around
in an approximately spherical region of 3-band space till about 0100hr on 16Jul,
when activity on 222 ceases. From there the locus of stays in the 50,144 plane,
but moves to a different region of 3-band space, with high 50MHz activity
and little 144MHz activity.
The 50MHz contacts are N1JEZ operating throught propagating the Es opening.
After this the locus returns to the origin.
Here's the same correlation image without the Es contacts of N1JEZ.
The activity now is nearly all in a spherical region at 2000-2400hr 15 Jul 00
(the time of the main opening), indicating that activity on the
3 bands is correlated. Well almost. Activity on 222Mhz drops to 0 for
some of these points. Is this because of statistical fluctuations expected
from the lower activity on 222MHz (117 contacts) compared to 50 and 144 MHz
(731 and 1739 contacts respectively), or is it due to the aurora curtain
flickering on and off on 222MHz while it stays on at 50 and 144MHz?
A test for this is to plot the distribution of contact intervals
(time between contacts) as a function of contact intervals for each band.
Processes, random in time, have a frequency distribution of type
freq-dist = e^(-scalefactor*t)
and will give a straight line log-lin plot. Processes which have the same mechanism
will have the same slope, even if the number of events is different.
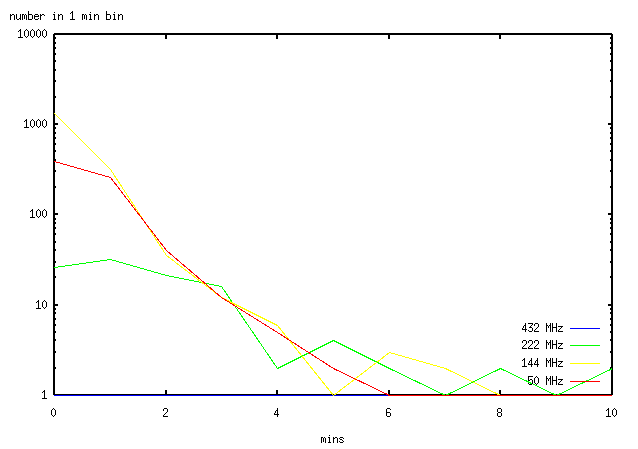
Here is the frequency distribution of contact intervals for each band.
I don't know the statistical method for calculating the error in the slopes,
which would allow me to determine if the slopes are statistically the same (anyone?).
By eye, the 50 and 144MHz lines have the same slope (if the data with small
number of members/bin is ignored, which I do without a mathematical justification).
The 220MHz line looks different - it's curved rather than straight.
I don't know if this curvature is real or an artifact.
With the relatively small number of logs, the curvature might be an artifact
of the accuracy in the recorded time of the contacts.
It may be neccessary at 220MHz to have 0.1min resolution, rather than 1min resolution.
The only way to find out would be to increase the number of contacts made on 220MHz,
or to change operating procedures to get higher time resolution
(which is practical, but operators are not yet aware that it is useful to do).
There's not enough data at 432MHz to draw any conclusions.
For the moment I will take the imprecise judgement of my eye and
accept that the 50 and 144MHz contacts are generated by the same process
while the 222MHz contacts are generated by another process.
Whether the different process for 222MHz is operators not being able to find each other
(lower power, lower aperture and more directional antennas),
the aurora curtain flickering,
operators not recording time of contacts accurately
(I only did the time accuracy on the total logs and not on the 220MHz operators separately),
or something else completely, I can't tell here.
(C) Joseph Mack 2000-2002, Joe NA3T, jmack (at) wm7d (dot) net, http://www.wm7d.net/azproj.shtml
Previous
Next
Table of Contents