Previous
Next
Table of Contents

Time Maps
This section contains a series of maps displaying the total contacts for the opening.
These total activity maps are themselves links to time animations of the progress of the opening.
Click on the displayed map to see the animation. The animations are large (3-5M).
If you are displaying the images though a slow connection (28kbd = 8M/hr),
it might be better to
download
the compressed image(s) (2-3M) and display them separately.
Note: In the time maps, the color scheme is rainbow order
- 50MHz
- 144MHz
- 222Mhz
- 432Mhz
For the time-distance maps, the color scheme is rainbow order
- 0-500km
- 500-1100km
- 1100-2175km
- >2175km
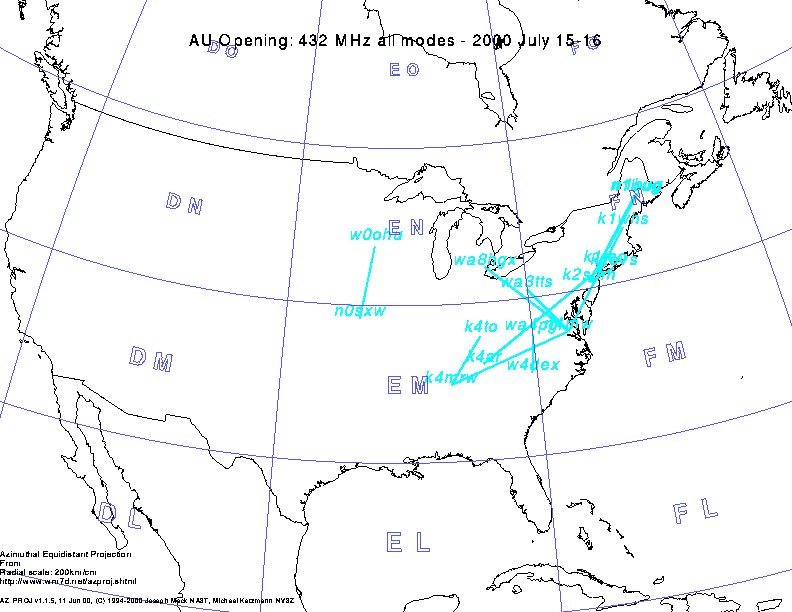
Opening on 432MHz all modes, 11 contacts
click on map for linked animation (3,600,737 bytes)
or download compressed animation
(2,479,347 bytes).
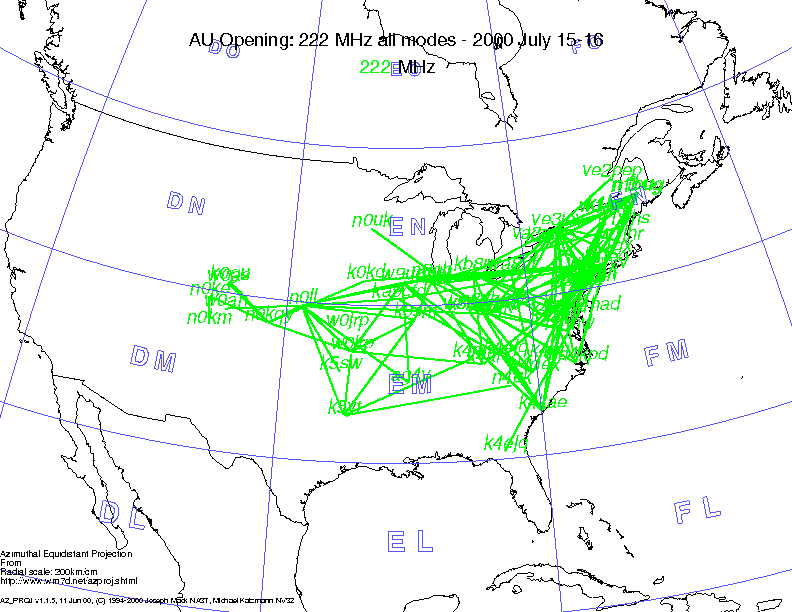
Opening on 222MHz all modes, 117 contacts
click on map for linked animation
(3,651,408 bytes)
or download
compressed 222MHz animation
(2,546,958 bytes).
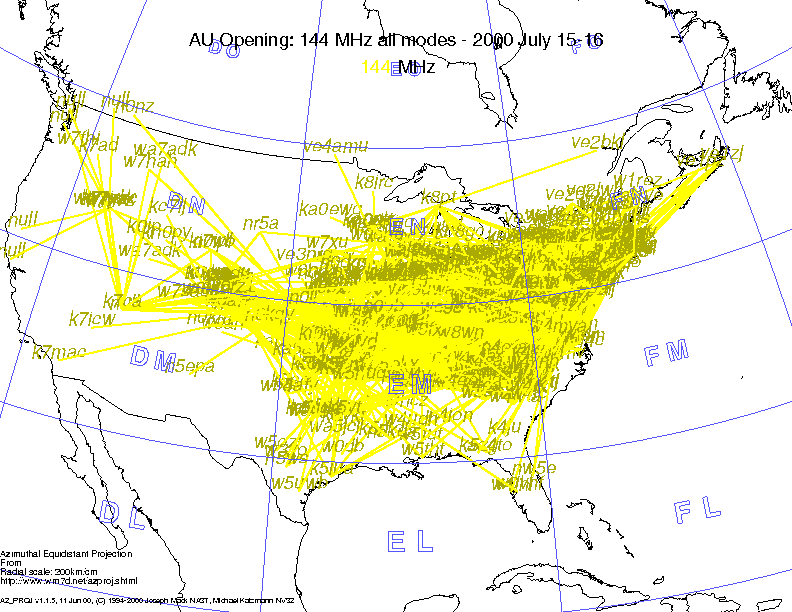
Opening on 144MHz all modes, 1739 contacts
click on map for linked animation
(4,145,923 bytes)
or download
compressed 144 MHz animation
(2,964,168 bytes).
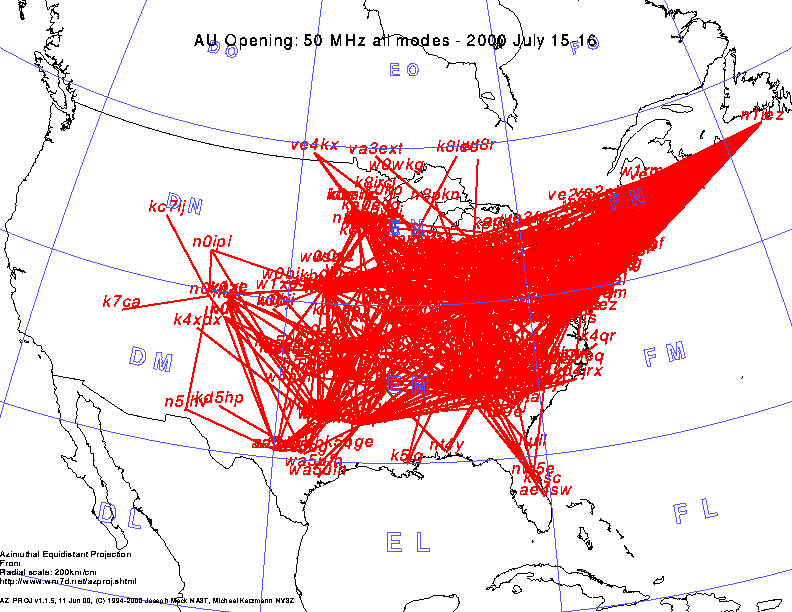
Opening on 50MHz, all modes, 731 contacts
click on map for linked animation
(3,861,256 bytes)
or download
compressed 50 MHz animation
(2,745,350 bytes).
(C) Joseph Mack 2000-2002, Joe NA3T, jmack (at) wm7d (dot) net, http://www.wm7d.net/azproj.shtml
Previous
Next
Table of Contents