
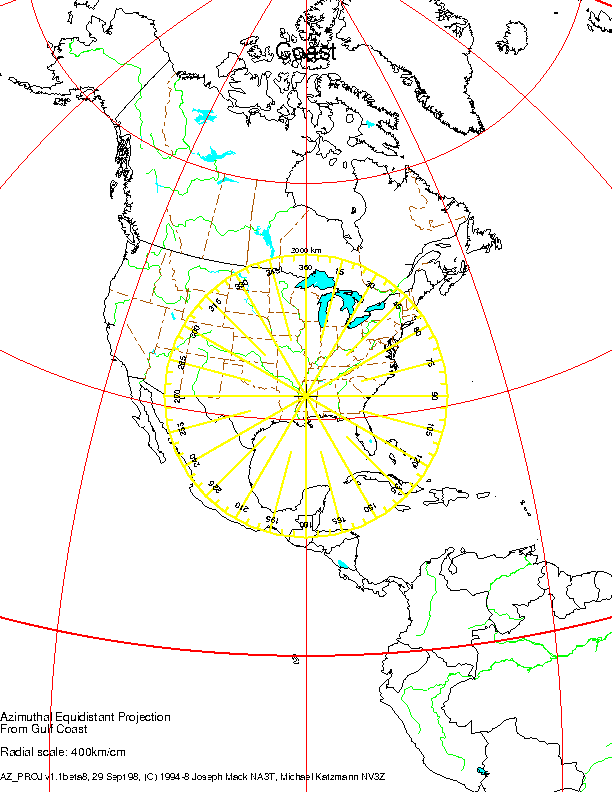
This projection gives a map in which points on the same bearing lie along straight lines. Distance along those straight lines is proportional to distance along the great circle with that bearing. This projection is unique for each place on earth and a new map must be calculated for each location.
AZ_PROJ is a set of postscript files for drawing colored azimuthal equidistant projection maps (bearing/distance or great circle maps) from any point on the earth (well almost, doesn't work at the poles) to any scale. AZ_PROJ is designed to draw maps for amateur radio operators (hams) to determine bearing and distance from their QTH (home, mountain top) to anywhere on earth. All you need to know is the QTH (lat/lon) for the center of the projection and the scale for the map. If you are an HF'er, you'll want the whole world, if you are a VHF'er, you'll want only your continent or smaller area.
AZ_PROJ is written in Postscript, and so is platform independant i.e. independant of the computer's operating system. Any computer coupled to a display or printer which can display postscript will do (you can use Ghostscript on PC's and Unix machines to display in X11 or SVGA, and to print on regular printers). Colored inkjet printers are now cheaper than B/W of only a few years ago, and can be used to make multicolored maps. AZ_PROJ has been used to make colored display/prints on a Mac, PC (DOS, DesqViewX, OS/2) and Unix (Linux, Irix, Hpux) machines.
The complete list of AZ_PROJ features is contained in the installation documentation (21,792 bytes, last updated 30-Apr-2002), which comes with the zip files. A FAQ (4,422 bytes, last updated 23-Mar-2000), is also available. The changes resulting in the current version of AZ_PROJ are in history.txt (12,372 bytes, last updated 21-Dec-2011), which comes with the AZ_PROJ package.
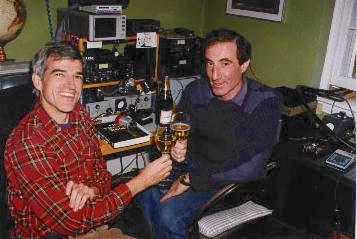
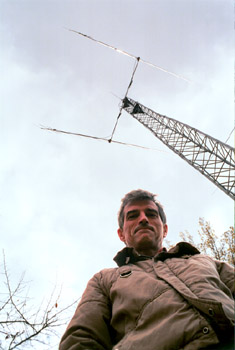
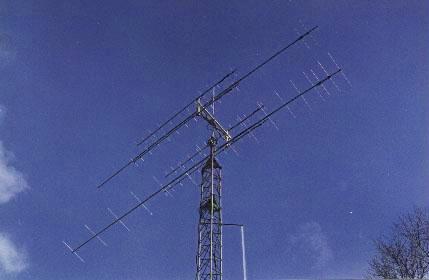
AZ_PROJ was written by Michael, NV3Z and Joe, NA3T and was described in a paper presented at the Jul 1994 Central States VHF conference. Here's Joe (on left) and Michael (on right) (jpeg of 19,651bytes) after our first EME contact (on 2m with W5UN) using 2 vertical yagis and 300W, Joe NA3T in foreground (jpeg of 14,326bytes) with a TV antenna rotator as elevation motor (photos by Mardee N3REQ, color balancing by GIMP and Michael NV3Z).
AZ_PROJ is a freely redistributable GNU public licensed postscript program. This license means that you are free to copy, use and redistribute the program (i.e the code), and are encouraged to do so, so long as you distribute the complete package as a unit, with the copyright notice and source code. However the commercial rights belong to us.
You are free to redistribute maps made with AZ_PROJ. If you so so, please acknowledge the authors, the code and if you made the map on the server, the url of the server. A suitable acknowledgement would be
Maps were made with AZ_PROJ, written by Joe NA3T and Michael NV3Z,
running on the AZ_PROJ map server at "http://www.wm7d.net/az_proj/az_html/azproj.shtml".
AZ_PROJ is released under the GNU Public License.
For the USA only
For a very accurate (<0.1m°) estimate of your location,
you can make a street map with MapsOnUs.
An approximation may be available from the WM7D Callsign Server, which uses the lat/lon of your zip code as recorded in your FCC address.
If you know the town name and the State, the lat/lon may be available from the geonames server.
lat/lon must be decimal eg 39.92 (not D:M:S) and can have any of these formats
The main reason that maps are not generated is that lat/lon are blank or invalid (lat=38.48.07 is not a lat).
The GIF output is presented for viewing by your browser. The other files are presented compressed in a zip file along with the gif. To generate a non-viewable file, first make a .GIF you like, then go back to the fill-in form and without reloading, select your new output format and rerun the map generator.
Specific help:
GIF, PNG and TIF are viewable with xv.
C:> copy/b 901234567.st6 lpt1
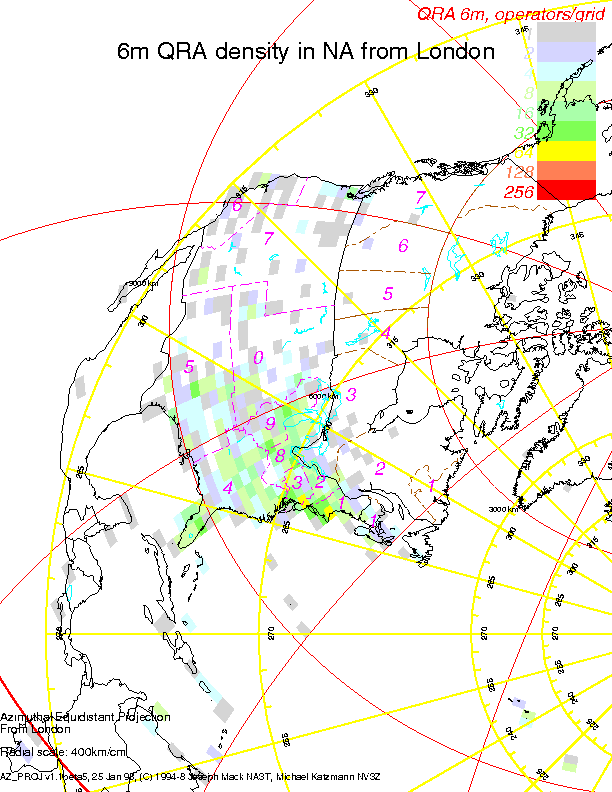
Another posibility might be to draw a map projected from London , but to have the center of the page being in the middle of North America and to only display North America. In this way 6m operators in London could determine azimuthal headings to locations in North America.
In both cases the azimuthal equidistant projection is still from your QTH, the map has just been translated across the page. Remember to enter the appropriate lat/lon for the new center of the page after you've turned on center_offset.
VHF operators use their 4 character grid locator
as a report in contests. A 4 character gridlocator is not unique - there
may be dozens of hams in any 4 character gridlocator in a contest. To plot
the location of a ham on a map, the 6 character grid locator is needed
and is used on the QSL card for VHF operators.
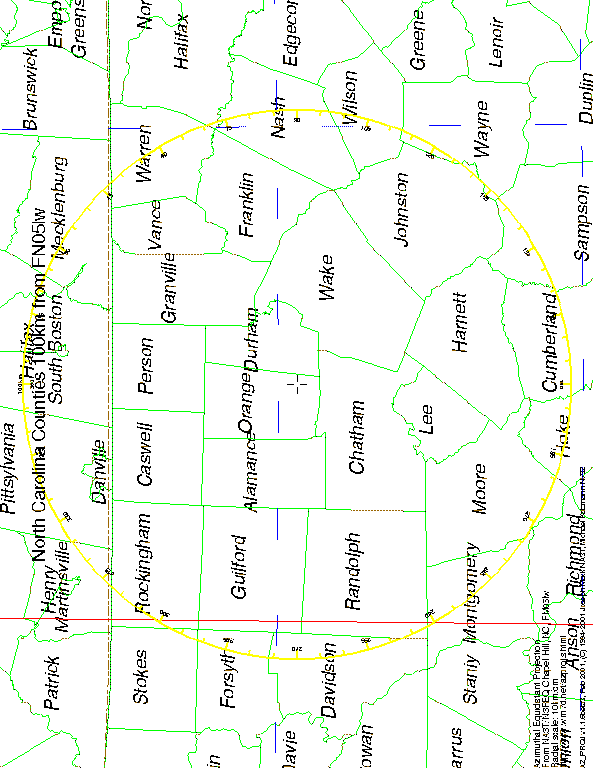
My location in North Carolina is FM05lw.
Here we only use the 4 character grid reference. It is reasonable
to draw letter squares for maps with
scales <500km/cm. For smaller scales,
the number squares can be included too.
Lat/Lon lines
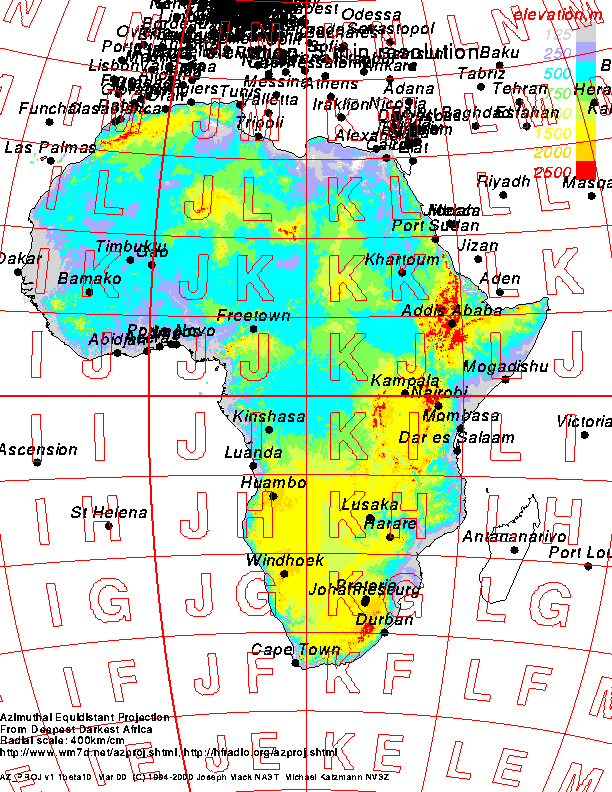
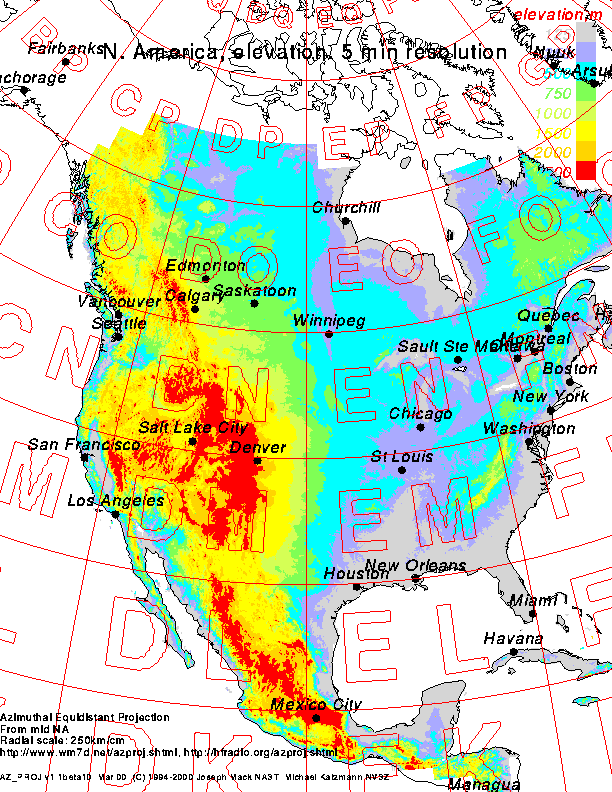
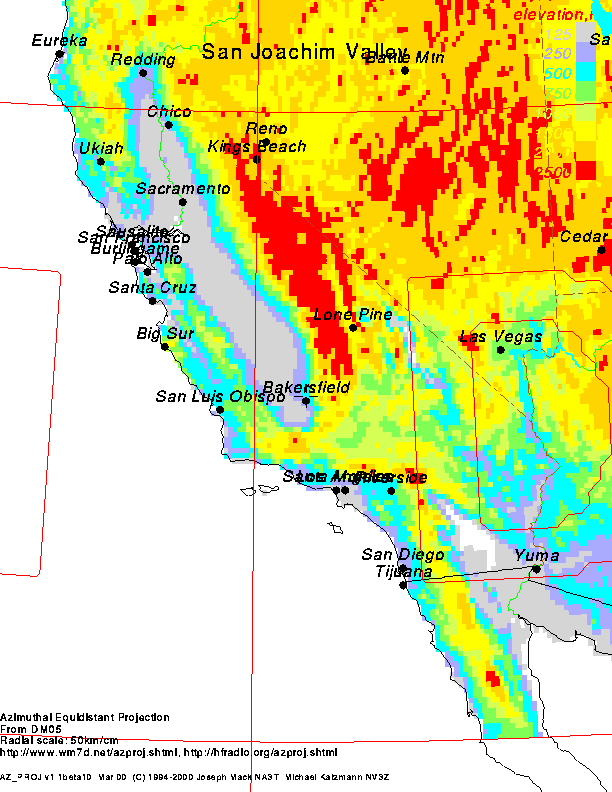
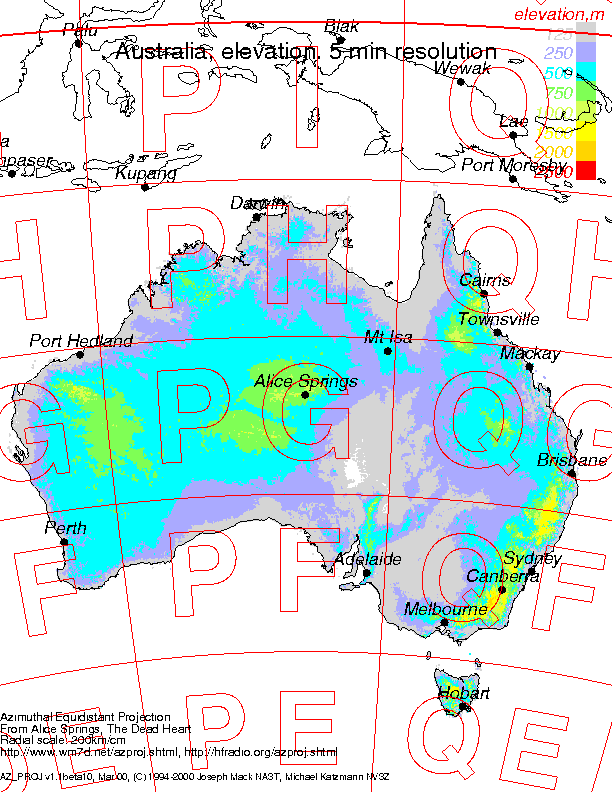
Elevation data with 5 minute resolution is from the "Global Relief" data set distributed by the
US National Oceanographic and Atmospheric Agency (NOAA).
Absolutely recommended is the cut-out 10cm
icosahedral globe of the world,
coloured with their elevation dataset (including ocean floor). Great on your desk and cheap
enough to give to all your friends for holiday season. (Disclaimer: I have no financial interest
in NOAA.)
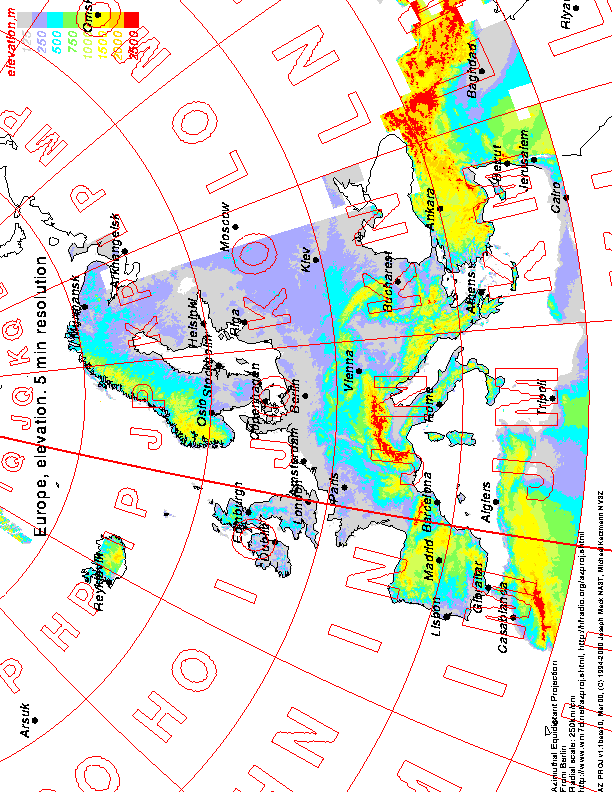
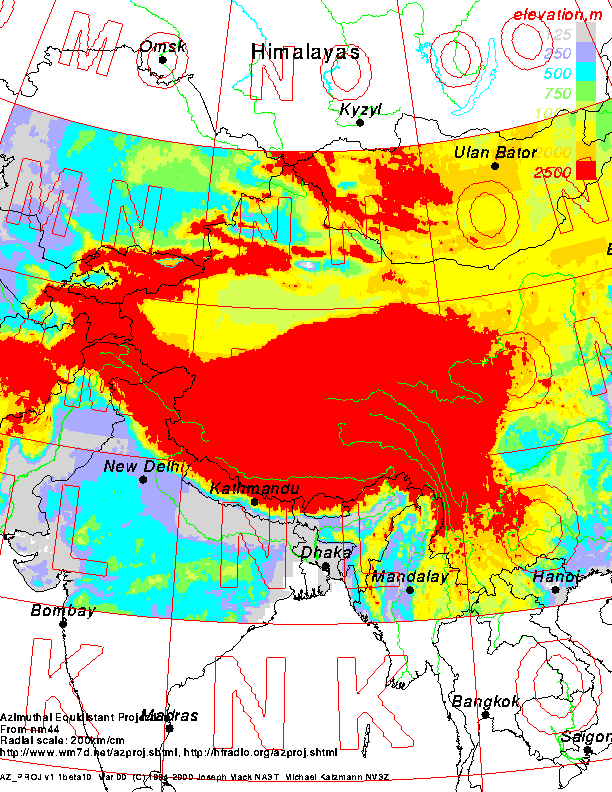
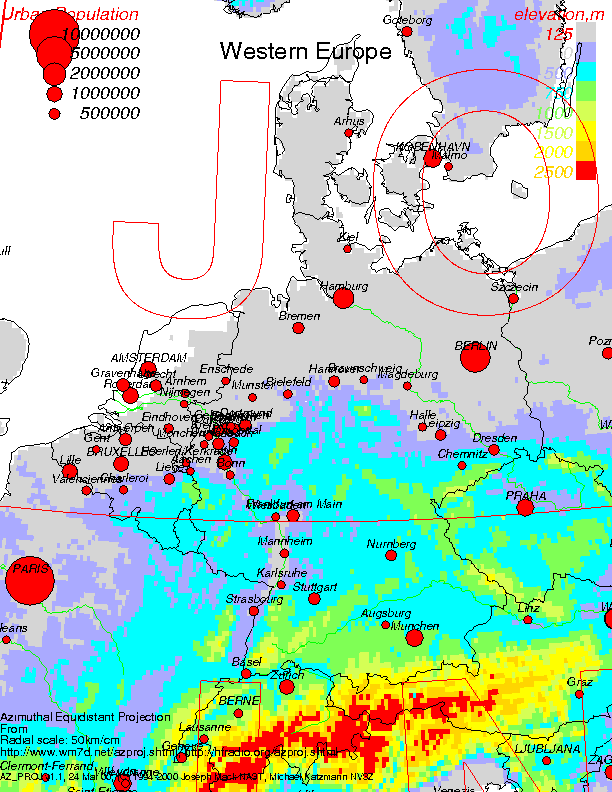
Here's sample elevation maps of
Height intervals are preset at 0,125,250,500,750,1000,1500,2000,2500m.
(In a future version you'll be allowed to select the contour heights yourself).
These take a 2mins/gridsquare to draw on the unloaded wm7d server. Preview the map without elevation
data before drawing the map with elevation data.
You still have to process the whole data set even if your map is only of a small part of the gridsquare.
The server will timeout at 10mins CPU time and
20mins connect time (ie you'll get your map if you and another person are simultaneously
making maps that take 10mins of CPU time). This limits you to about 5 2char gridsquares/map.
A standard (800x600) image contains 0.5M pixels. One gridsquare
of elevation data contains 60k (10x12x20x12) elevation points.
(8 2char gridsquares plotted on a image will give 1pixel/elevation point
- there is no point in trying to put more than 8 gridsquares onto a map).
The legend (vertical strip of colors at top right of map) for the elevation
data is written for each gridsquare before
the elevation data is plotted. This may lead to the legend being overwritten by elevation data.
To handle this, plot another gridsquare after the one that overwrites the legend
(eg if the legend is the middle of FN and is overwritten by the FN elevation
data, then drawn grid_square FM after FN - ie choose both FN then FM).
Call Areas
Canada: Does anyone know the call areas for Yukon, NW Territories.
Also do I have Nova Scotia etc correct?
New Zealand: What is the division between 1/2 and 3/4? Is it
a lattitude line or is it more complicated than this?
Other areas: You send in the data and I'll put it here.
As you change the papersize, the size of the png image does not
change (if you ask for a scale of 1000km/cm, the image will
be 1000km/cm in all papersizes). The clipping size changes by
a factor of 2 each change in paper size. Portrait US ledger and A3
are wider than high (don't ask me why).
On a US printer, A4 output is longer than US letter and prints a little bit on a
following page. The ledger output prints the top
half of the output. The half sized output gives the image at the
nominated scale, clipped to half size.
If you want to draw a larger map than your printer can handle, the simplest
colutions is to
join 2 or 4 printer pages together by putting the center_offset
to 4 different places, while keeping your QTH constant.
The .pdf images are the correct size, but unlike the other outputs, the
file size does not change.
You can choose greylines for
The
position of the greyline may have no relationship to your QTH.
You may want the location of the greyline a 3am local time.
You can enter your own time or choose the default (the current time).
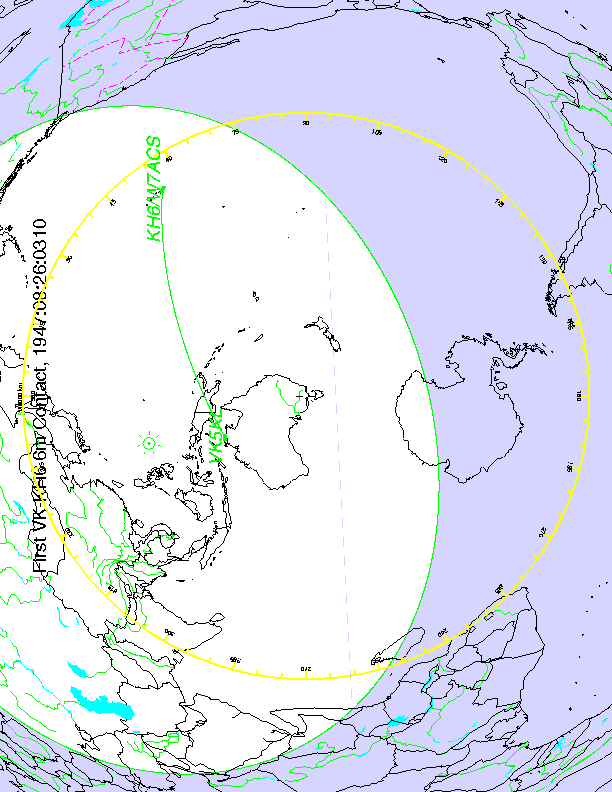
Here is a map showing the
first 6m contact from VK to KH6 (in 1947)
(image of 28,283 bytes).
The center of the projection is from VK3OT
(http://www.uksmg.org/vk3ot.htm, link dead Feb 2004)
who has assembled a history
of contacts. This contact was contained in the database of
VK5LP. The great circle
path for the contact is drawn with the "QSO" feature of AZ_PROJ
available in the downloaded version. This feature is designed
to find Es scattering centers by plotting propagation paths during an opening.
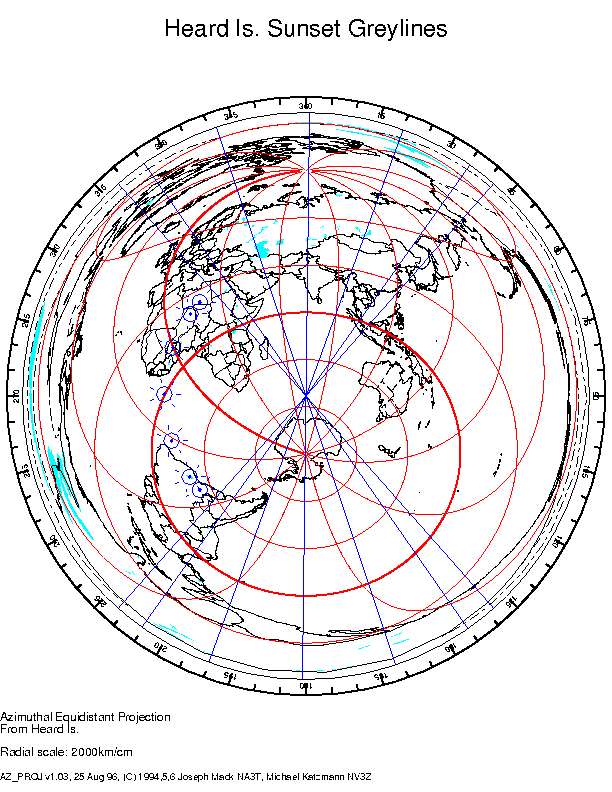
sunset/sunrise lines throughout the year - the server will draw
the greylines for your QTH at the 22nd of the month from Jul-Dec
An example
sunset greyline map
(image of 34,979 bytes)
is drawn for Heard Is.
The position of the other 6 months of greylines is symmetrically
displaced (eg greyline for Feb is the same as for Oct). If you plot
the scale large enough (whole world), you'll see the position for
the subsolar point for each greyline. This is useful to determine
the best time of year to contact various parts of the world.
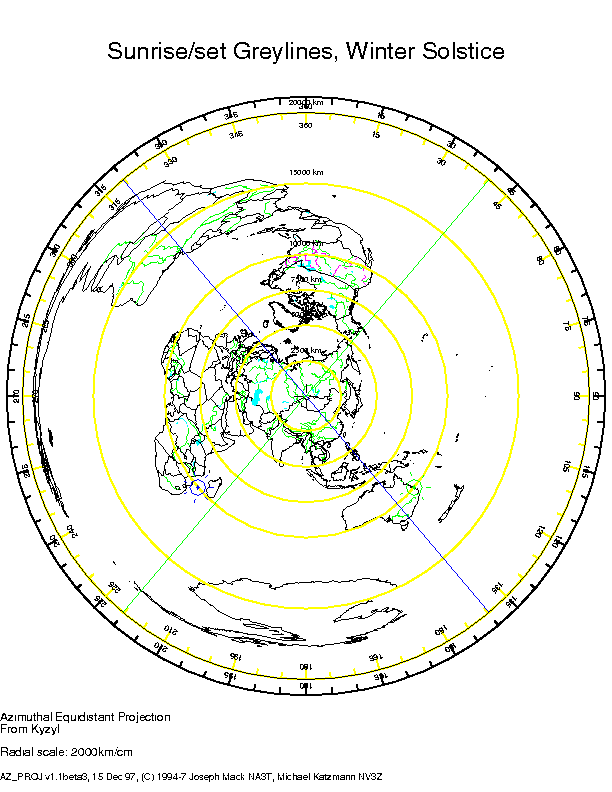
Another possibility is to draw both sunset and sunrise for a particular
day at your QTH. This is useful to determine the contacts that can
be made by greyline for say a DXpedition or a weekend contest. An example
shows the greylines for sunrise and sunset at the winter soltice in
Kyzyl
(image of 27,268 bytes)
The earth's orbit is sufficiently circular that for ham radio purposes,
the position of the sunrise greyline is the same as the sunset greyline
for dates symmetrically related to the solstices (eg 22Nov, 22Jan), ie,
the position of the sunset greyline in December is the same as for the
sunrise greyline in June.
It's possible (but a little tedious) to make maps every hour for an HF contest.
Here's an animation of
an hourly set of maps drawn by K1TTT
(image of 1,309,635 bytes).
So now you know, you can be out walking with your friends at
noon in Nov or Feb, casually look up at the sky and say "That
sun sure doesn't look in the zenith to me."
Analemma links
2.
You can chose concentric circles around the QTH at any interval, the outer circle having
compass directions.
If you want to turn off all compasses and circles, click the compass on and
then turn off both the rose and the spokes.
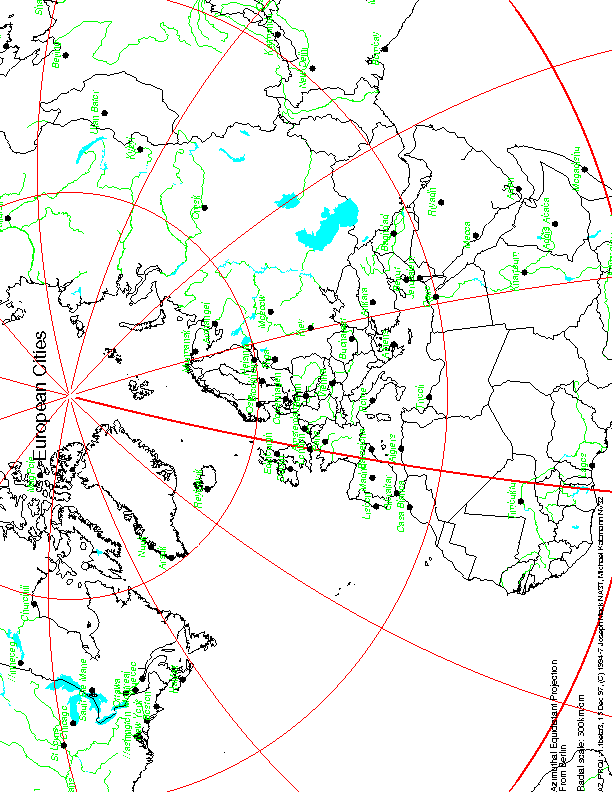
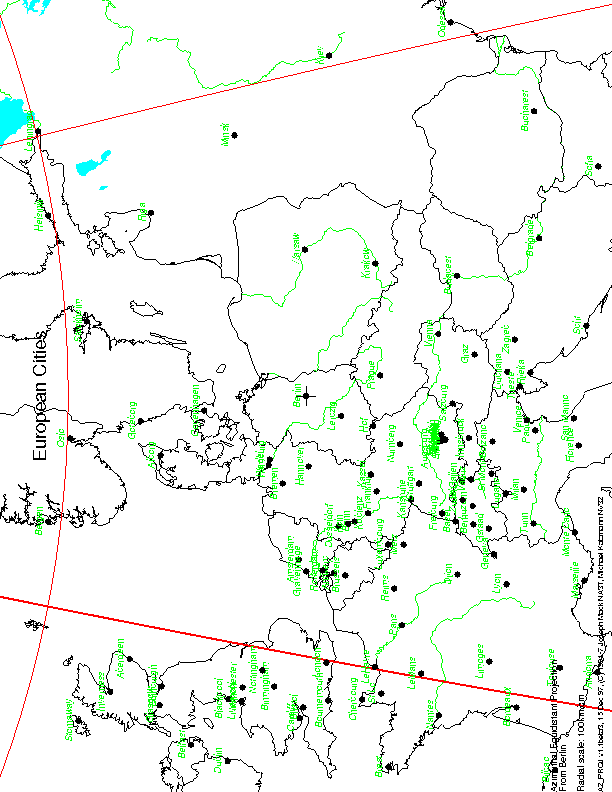
Minor Cities - 600 entries - for maps smaller than a continent - scale <250km/cm
An example map from
Berlin at 100km/cm
(image of 28,064bytes).
Since the city density varies greatly over the
surface of the earth, I've compensated by putting some smaller cities (eg
Churchill, Canada) in the Major Cities list. The minor cities list contains
cities from the city_maj.dat list too (ie you only need select minor cities
if you want all the cities).
Capital cities for a country are all uppercase.
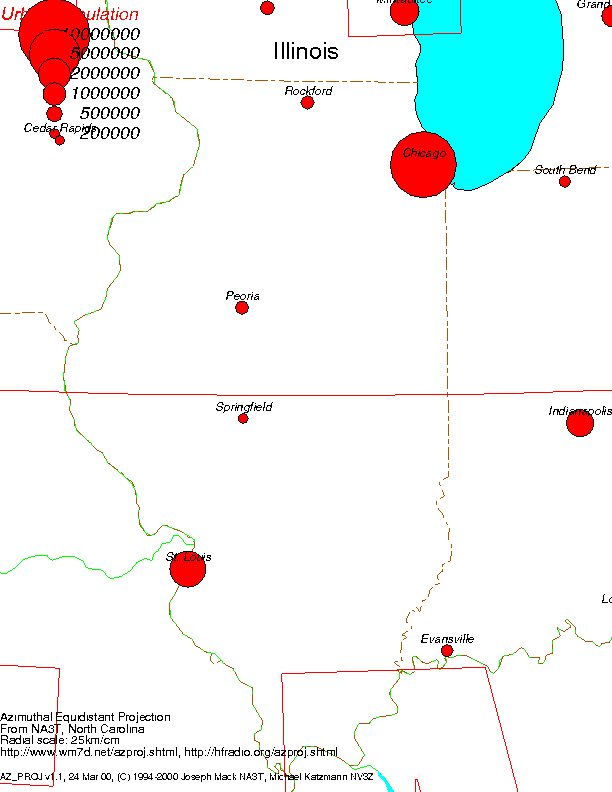
Example maps are for
NW Europe (default threshhold=500000) with elevation ,
Illinois, USA, (default=200000),
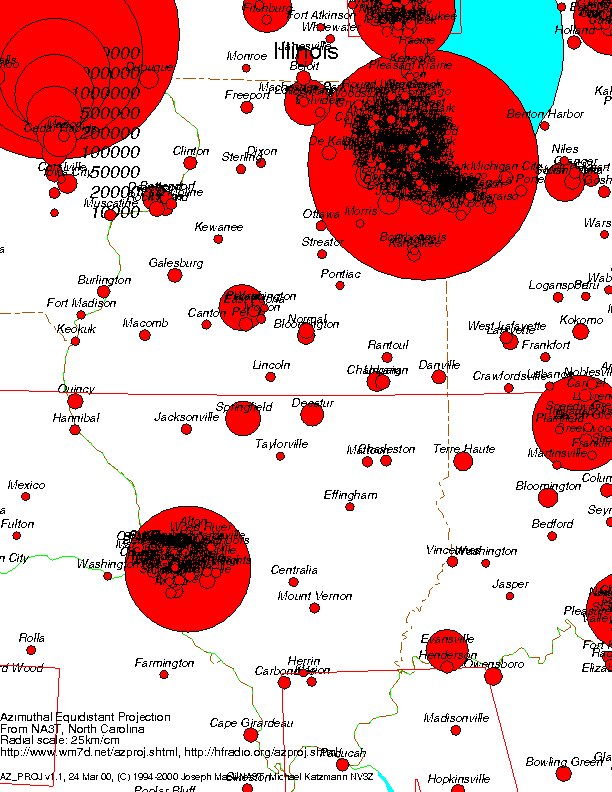
or with a non-default population threshhold
Illinois, USA, threshhold=10000
and
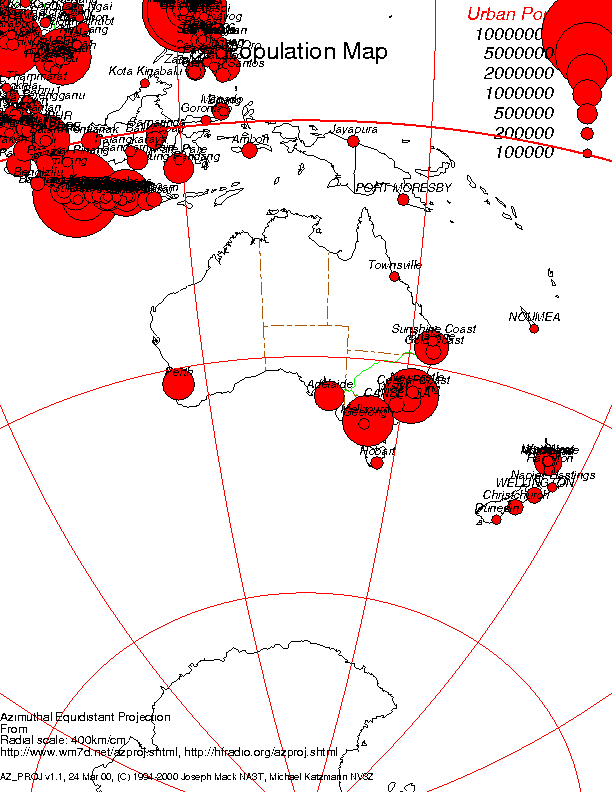
Australia (threshhold=100000)
(default=1,000,000). Note how lowering the threshhold makes the symbols bigger for
the same population.
Not only do we have the usual 50 states with their well known 2 letter
abbreviations, but also American Samoa (AS),
Guam (GU), Northern Marianna Is (MP),
Palau (70), U.S. Minor Outlying Is (UM),
US Virgin Is (VI),
Federatied States of Micronesia (FM) and the Marshall Is (MH).
Examples
There are 2 options. Assume you are in Geneva (Switzerland), enter your
QTH (lat/lon or gridlocator) as usual
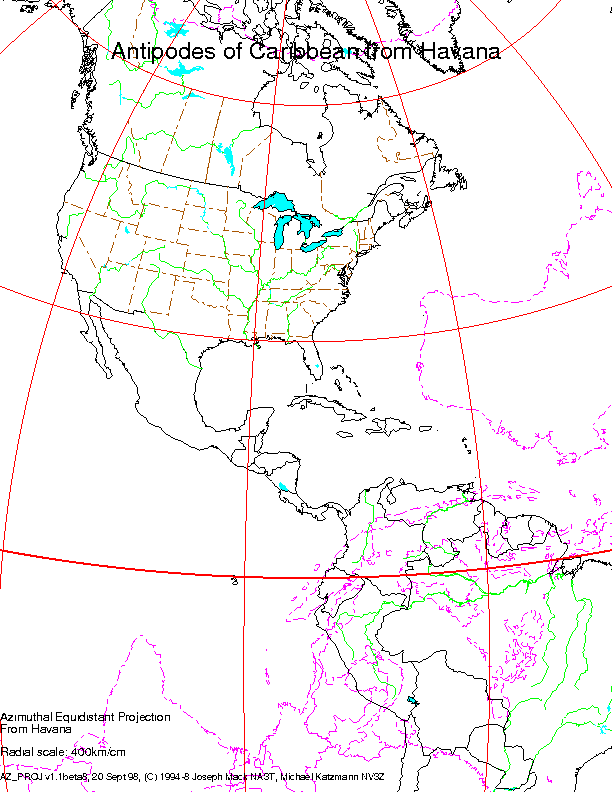
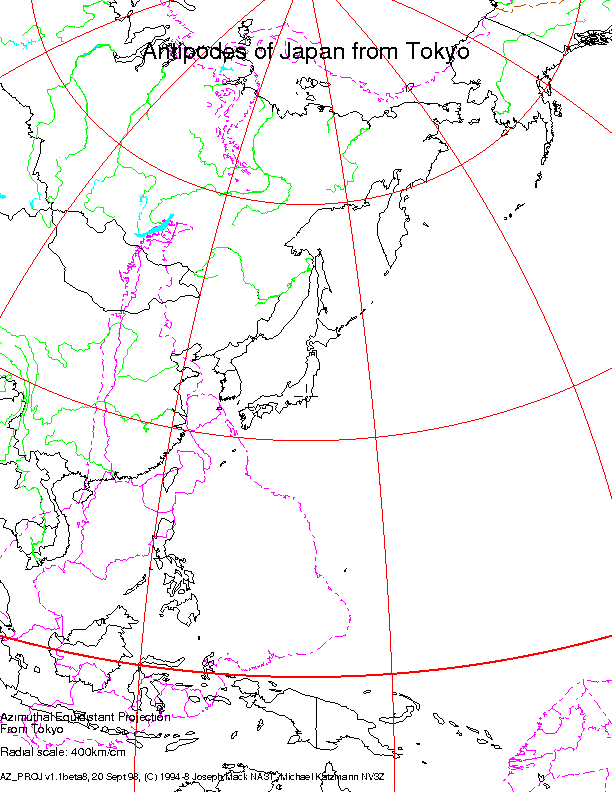
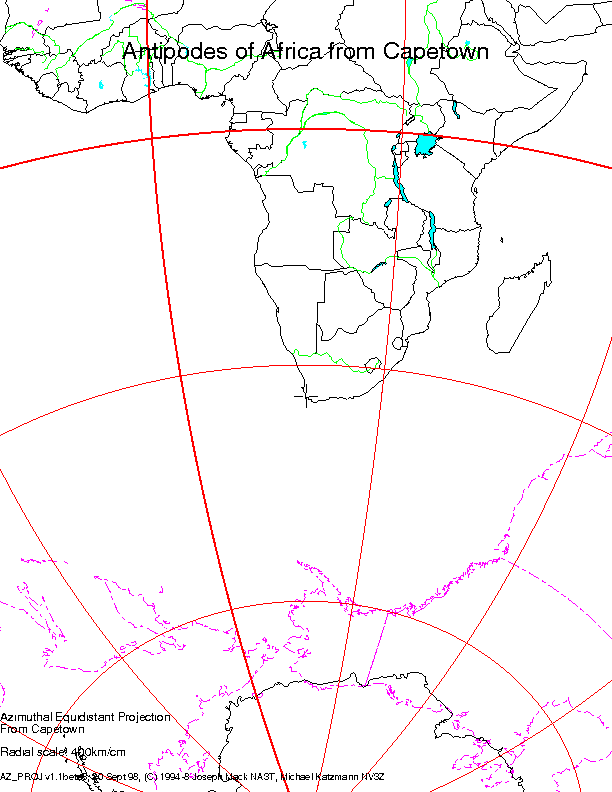
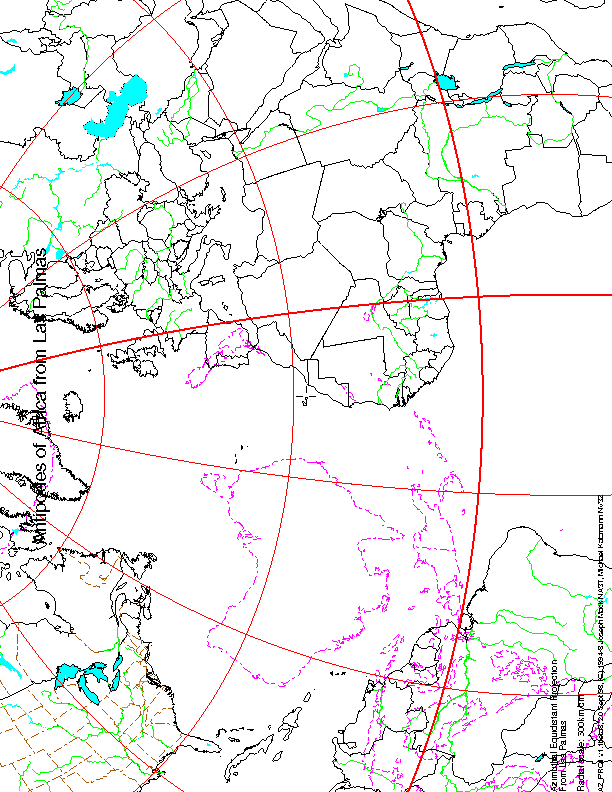
Other sample images (all about 25kbytes) from
Havana,
Tokyo,
Capetown,
Las Palmas,
Honolulu,
and
San Diego,
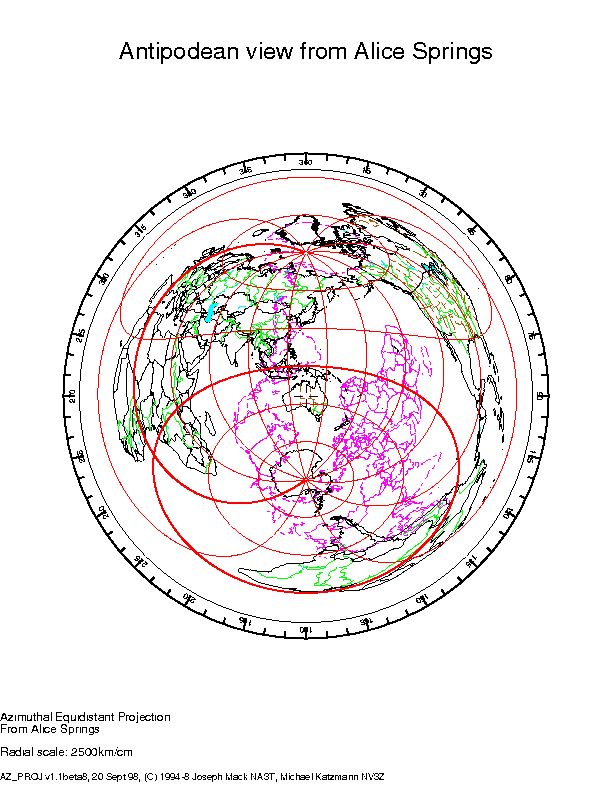
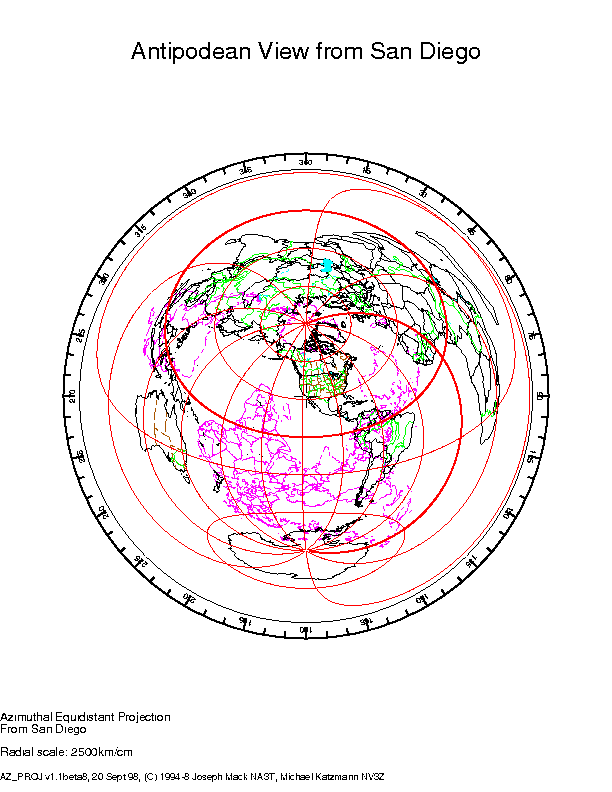
There are not a lot of land-land antipodes pairs. To look for them
heres a view of the whole world from
Alice Springs and
San Diego.
The beacon list used here is limited geographically and is a little out
of date (1994). However things have improved dramatically recently
and a machine readable list of all the transmitters on earth is being
assembled by Colin K4SSO/AA0YT (his website is no longer up, May 2002).
It would be very easy to add lists of repeaters and packet stations.
Here's further info about
machine readable lists.
TV Stations as 6m Propagation Markers
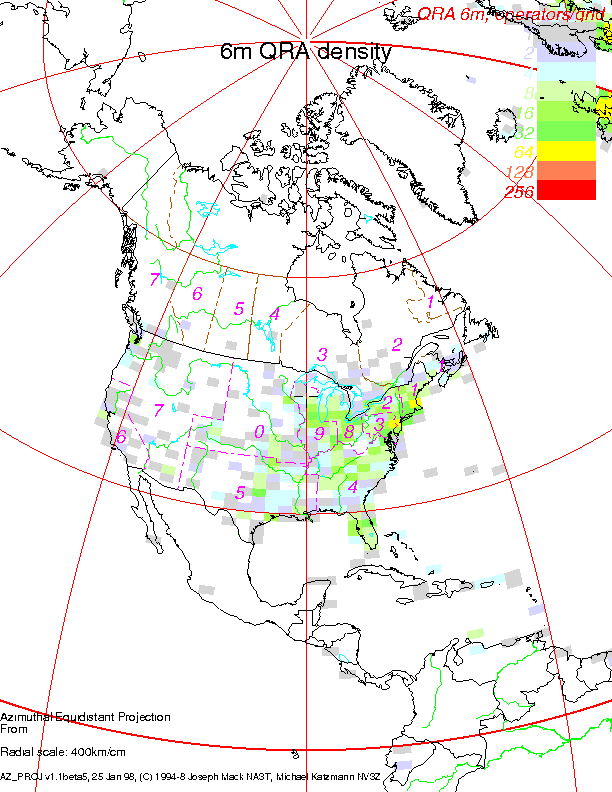
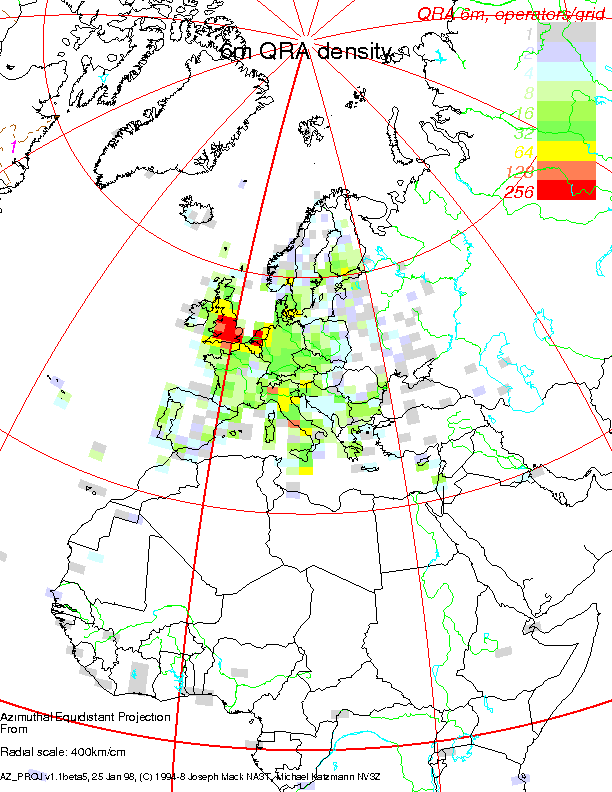
6m QRA list
6m QRA Density list
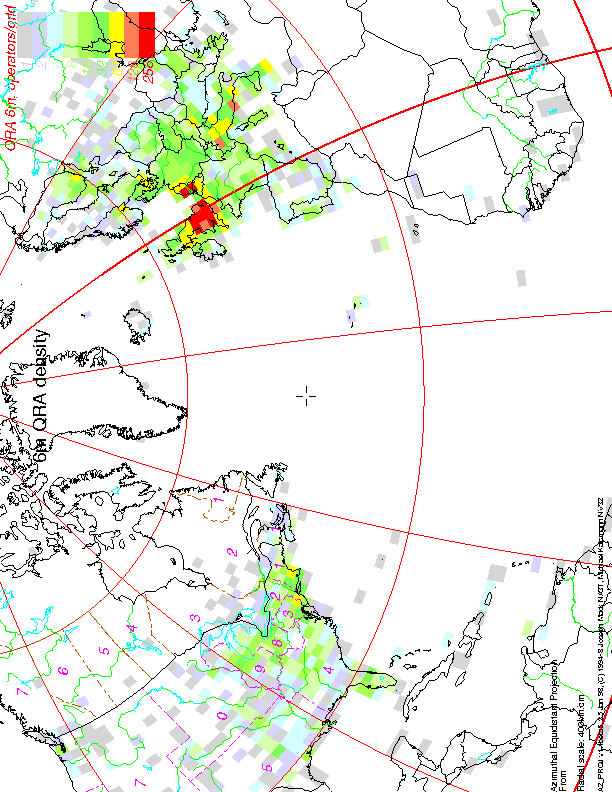
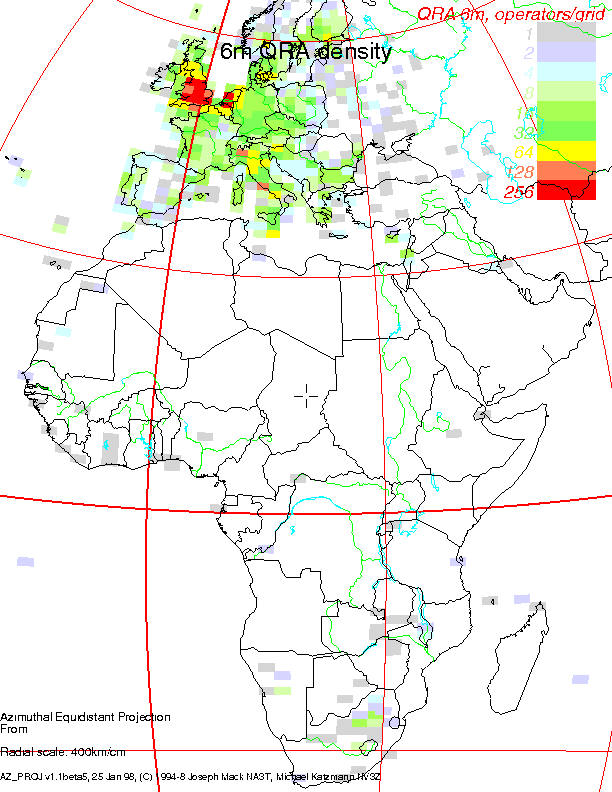
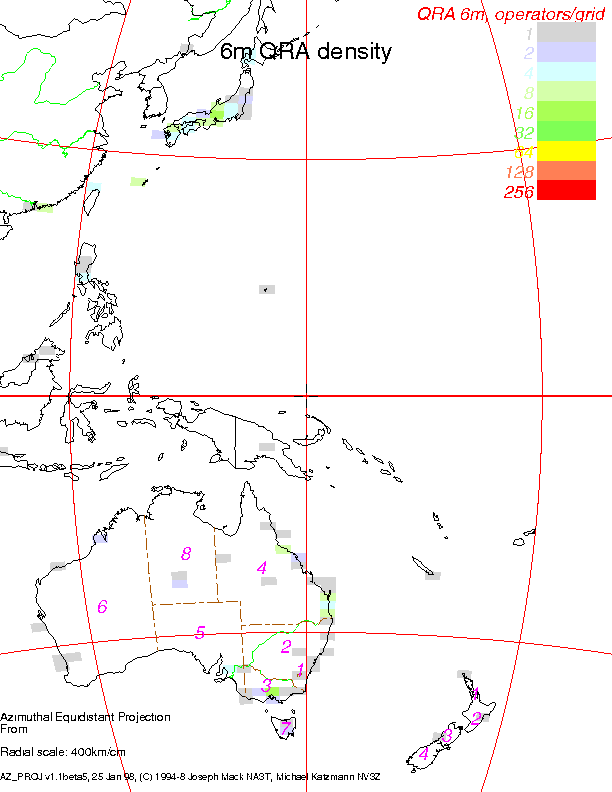
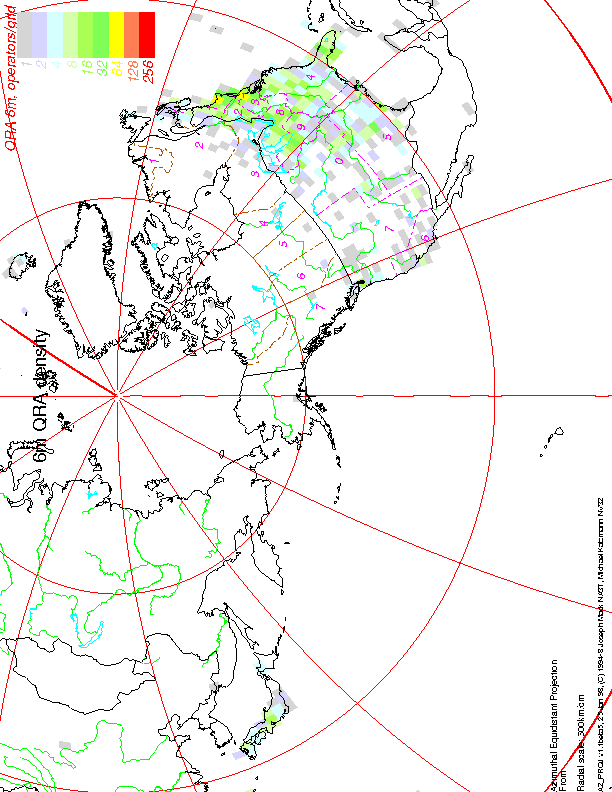
Sample maps (all about 30kbytes) from the Jan 98 list, show 6m QRA density in
North America,
Europe,
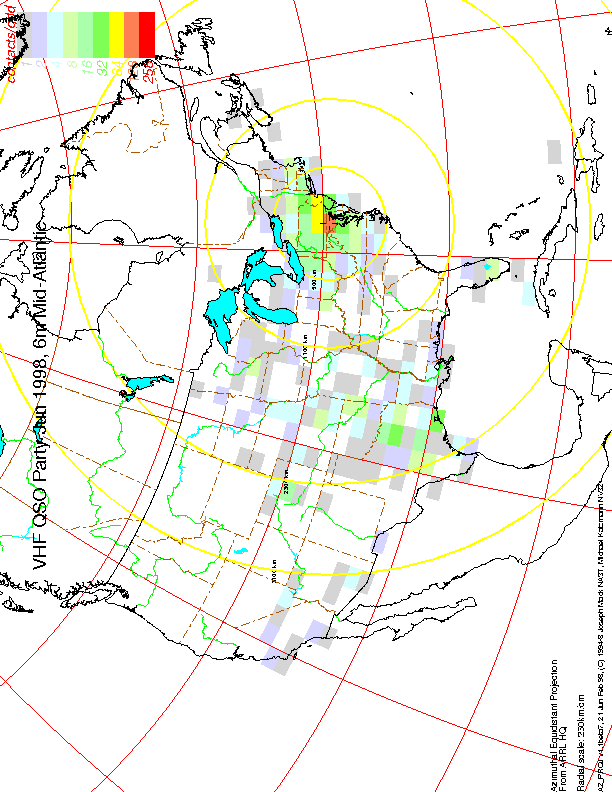
the transatlantic path between Europe and North America,
the TEP path between Europe and Africa,
the TEP path between Oceania and East Asia,
the polar route between North America and Japan
and the offset map of North America from
London. Copies of these maps are on the
UK 6m Group Home Page.
Note that outside western Europe and Eastern N.America the density of 6m operators
is low. Maps that include other areas on large scale (at 1000km/cm or larger)
will need to turn off countries/rivers/lakes etc to be able to notice the
small blobs of light color that represent a gridsquare at that scale. You
probably need a scale of 500km/cm to see anything. If you want to display
an area 2 F hops away, then use the center-offset feature to put that
area in the center of the map.
Are there really no 6m ops in Antarctica?
On a limited color display (eg a 1M
video card, at 1024x768 pixels, on a screen where a browser has already
grabbed many of the colors) it is difficult to produce a satisfactory
spectrum of colors in a .png file. The palette I'm using ran on my screen, but
may not produce useful colors on yours. If you are having color problems
look the info on reduced color sets . You might find
the wrong color (non-rainbow order, black or blank) in the legend instead
of the expected color. The real color will appear in a printout on a color
printer, or on a screen with no other images. If your results are unsatisfactory
let me know and I'll see what I can do.
I started with the idea of helping Rovers, who operate under stressful and noisy conditions
go to lots of effort to go out on the road and give the fixed stations multipliers
from unpopulated gridsquares - these guys deserve all the help they can get.
Max DL4MQD has been maintaining a list of most wanted grid squares for DL land.
At the end of each VHF contest season, vhf'ers send in the grids they most want
to work for the next year. These lists are useful for people wanting to plan
grid-DXpeditions, rover trips and family vacations (Dear, I've just found this
lovely spot in FN96 for our next family holiday...).
I started making the maps
for these lists a few years ago (see DL8EBW)
and have thought that such a list would be useful other places too.
A starting point for a more general list might be the list of the grids worked
by VUCC award winners that is maintained by the ARRL. Unfortunately this list is not
available because of privacy concerns and because the ARRL is too busy to answer
such requests. Another approach I took was to try to obtain the logs that are electronically
submitted to the ARRL contest committee. These are also unavailable for the same reasons.
I have a request in to the ARRL for hams to be able to give permission for logs to be used
for propagation studies, but have not received a reply.
Here's the high density maps
Joe NA3T jmack (at) trilug (dot) org
When you mail me, please do the following
IOTA is a list of about 1000 islands chosen by the RSGB that are of interest
to hams looking for rare DX. There are several websites about IOTA including
one run by the RSGB IOTA.
The list of islands is freely available but the lat/lon of the islands is
not on any of the websites. To save myself time in a finding these islands
and their lat/lon, in early 2000, I contacted people on the IOTA webpages.
After several months, the IOTA QSL manager Roger G3KMA replied that the RGSB was selling
a list of the lat/lon, it was copyrighted by the RSGB and I wouldn't
be able to use it on the az_proj website. He suggested that I could do
a joint project on the IOTA with them, but never replied to my further enquiries
on collaborating and didn't reply again a year later when I contacted him again.
Here's my e-mail exchanges with the RSGB on the matter.
The original contact
At this stage I could go to the library and assemble my own
IOTA lat/lon list, as I originally intended.
However it seems that IOTA is not a bona fide ham activity,
for and by all hams facilitated by the RSGB,
but an award run as a source of revenue for the RSGB.
While in the '60's, the RSGB was my main source of technical books on
ham radio and did a good job of educating hams,
it would appear that the RSGB has lost its way and has forgotten its purpose.
If you want the IOTA islands on your az_proj maps,
you could remind the RSGB that they don't own IOTA -
they may have thought of it, and they may be the main ones fostering it,
but they are only facilitating it for the ham community and it belongs to ham radio.
Although Pratas sounds like a tropical paradise,
it is the center of military tensions between China and Taiwan.
As well, unrestricted fishing (sometimes using dynamite) has
depleted the stocks of fish and seriously damaged the coral reefs.
From my childhood reading,
I remember the South China sea as a hangout for pirates.
Pratas Is. is only for the adventurous.
More more info on Pratas Is. see
A Brief Introduction of South China Sea
OK I lead you on.
Lists are usually maintained by volunteers and are passed around
for the benefit of a relatively small proportion
of the amateur community. There has been little need for machine
readable lists. However with larger numbers of people getting
home computers, machine readable lists are very useful.
Emil W3EP's list of N. American vhf/uhf beacons is from
a spread sheet and required little hand editing. The DXCC list
is maintained by Bill K2DI and also required little editing. AZ_PROJ
is set up to read these two formats.
The Region 1 6m list(from M. Harrison, G land)
was taken from a posting on the internet and required
major editing. It would be nice if these lists could be used straight
from e-mail.
I have contacted several people who maintain these lists,
and they realise the virtues of machine readable lists. However
till someone chooses an acceptable format, that all can follow, it
appears that things will remain the same.
There are two parts to the problem; the file type and the
format of the information in the file.
File type: The file needs to be readable
by any computer and e-mailable. The lists should be ascii with no platform
or program dependant information. The field delimiter should be unique
in the file (eg :,|). Tabs do not travel well as some programs convert
tabs to spaces. The delimiter should not be a space as comment fields will
have spaces. Since delimiters can be changed easily, there is no need
for an agreement on it. The file should be importable into a spreadsheet
or database.
Information Format: Here is a suggested format based on the AZ_PROJ beacon list.
beacon:144.277:VE1SMU:GN03:10:270:940500:W3EP:;winter opn unreliable
The syntax is
type_of_entry (beacon, repeater, TV)
Joe NA3T jmack (at) trilug (dot) org
If you know of any lists that could be drawn on AZ_PROJ and they
are freely redistributed, please let me know.
I'm quite happy to be in on any committees to help set up
an acceptable machine readable format.
If you are involved with lists (get them, maintain them, use them
in this program and don't want to wait for me to edit them)
then I would be glad if you could help the conversion to
machine readable formats.
Thanks Joe
By profession, I'm originally an organic chemist,
who became a biochemist. My greatest success was working
out the mechanism of the Integrase enzyme in the AIDS virus
(HIV), the enzyme in HIV that incorporates the virus'
DNA into your DNA, thus turning you into a factory to make HIV.
I did this using computers and large databases of DNA sequence information
(bioinformatics). My proposed mechanism of the enzyme allowed
me to find drugs that stopped this enzyme working, even
before the structure of the enzyme was determined.
One day I realised that the computers I was programming and
administering as part of my experiments were a more remunerative
career path than research and in 1997 after 30yrs I left research.
I'm now a Senior Systems Engineer working on a pair of Crays.
Other than ham radio, I am amateur astronomer, like hiking and use Linux.
I'm a contributor to the
Linux Virtual Server Project
Although I miss the science, I do not miss the bloodletting and power mongering
that accompanies it.
As a career move, doing a PhD in biochemistry was a bad idea.
I worked on an agricultural problem expecting to be hired in Australia
to find solutions to Australian problems.
However at the end of my PhD I was told that there weren't any jobs
for me in Australia and that what I needed was "more training" and
the only place to get this was overseas.
Unlike my Australian PhD, where I was expected to run my own research
and think up and work out my own ideas, when I got to USA I found that
"more training" (post doc'ing) was devoid of bright ideas and was
dependant on the much larger amounts of money available in USA.
People rushed to do the experiments that were obvious to anyone
attending the year's research conference. "More training"
also turned out to be low paid (about the same as a typist's) and I noticed
that few american's were doing it. Mostly it was people from other countries.
Americans were becoming lawyers, medical doctors and engineers,
where at the same stage in education,
they were living on salaries many times mine,
buying their houses and on the way to becoming partner.
I was moving jobs every 3-5yrs and not able to put equity into a house,
while the people who I worked for drove Volvos,
worked 40hr weeks and owned their houses.
My attempts to do "useful" work,
like cure diseases, were not received well.
Science moves on publication in top journals of easily recognised goals.
Difficult problems, like curing AIDS shouldn't be rushed into;
you could wind up not being funded.
A successful scientist is expected to become a manager in 5yrs or
be dropped from the promotion chain.
A successful lawyer on
the other hand is expected to become an even better lawyer.
I worked for the US Dept Agriculture, the National Cancer Institute and the
National Inst. Health, all the while trying to turn my "more training" into
a job back in Australia. It turns out there had never been any jobs
back in Australia and that "more training" was just a ruse to get me
out of the country, so that when I realised that all I'd accomplished
in my PhD was to maintain the academic pyramid scheme, I would
be out of the country and they wouldn't have to hear me yelling.
Each academic produces about 30 PhD's in their lifetime only 1 of
which will replace him. The rest have to exit from research science.
I changed to computing, thinking there would be a reasonable chance
of getting back to Australia that way, but never found any computing
jobs in Australia on my trips back. On my visit to Australia, in Dec 2001,
the Foreign Minister Alexander Downer, recommended that Australian businesses
move all their IT to India, where favourable bankruptcy and labour laws
were better for Australian industries.
It was true, I picked up the phone to ask about telephone charge rates
and was switched through to a woman with an Indian accent and sitar muzac.
If I returned to Australia, they would kick me out a second time.
I've taken out american citizenship. I'm not exactly happy about my circumstances
and am no more happy with the politics of Australia than I am with the
politics of USA, but I'm here and I'm going to make a go of it.
Neither Australia nor USA value their citizens.
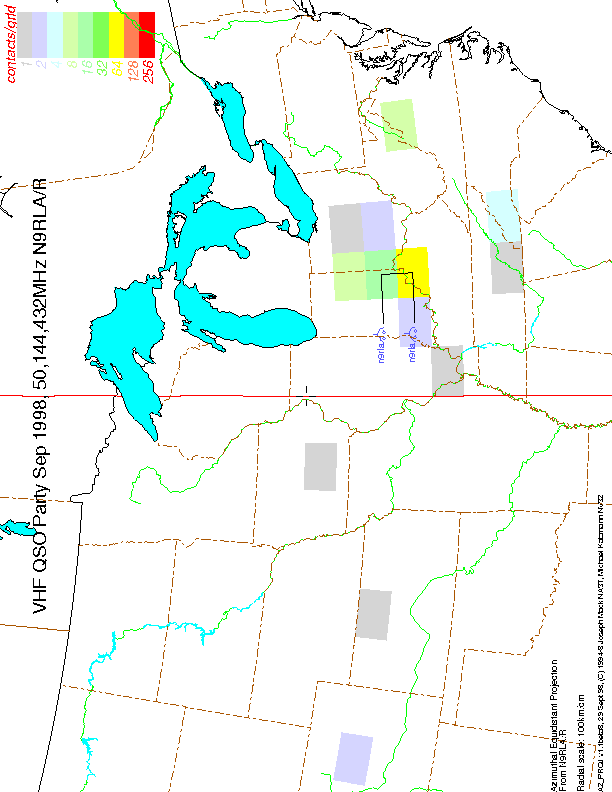
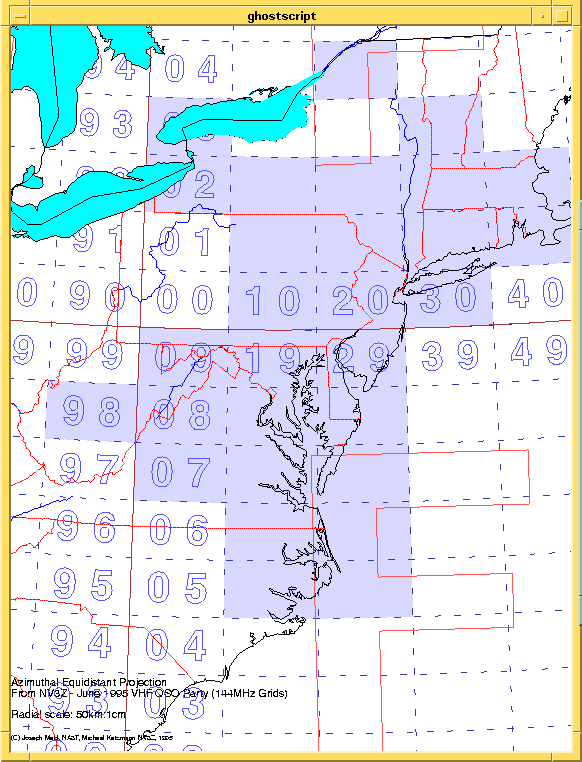
grid square map with worked grids
(image of 24,434bytes)
can be made after a contest,
for each band, as was done for our efforts in the
Jun 1995 VHF QSO party. Our QTH was FM18rx, in Annapolis, just east
of Washington DC, USA. For the contest we used
2x5wl on 2m and
homebrew 4x5wl on 432
(jpeg of 13,938bytes) with masthead
preamps and 300W on each band.
The Parallel Lines Contest Group
stores their contest entries in a database and uses AZ_PROJ to automatically generate its
contest maps.
While you're there look at their setup
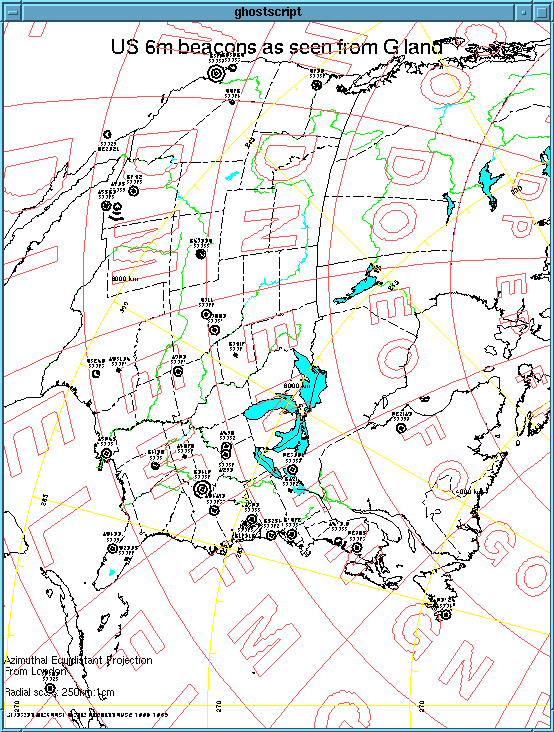
You can have the center of the projection off the page. For instance
a ham in London could display the
the US 6m beacons
(image of 34,921bytes)
to watch for transatlantic openings. Note that the bearing from England
to North America is north-west. The same map can show the
density of
6m operators in North America. For more of these 6m maps see
the UK 6m group QRA page.
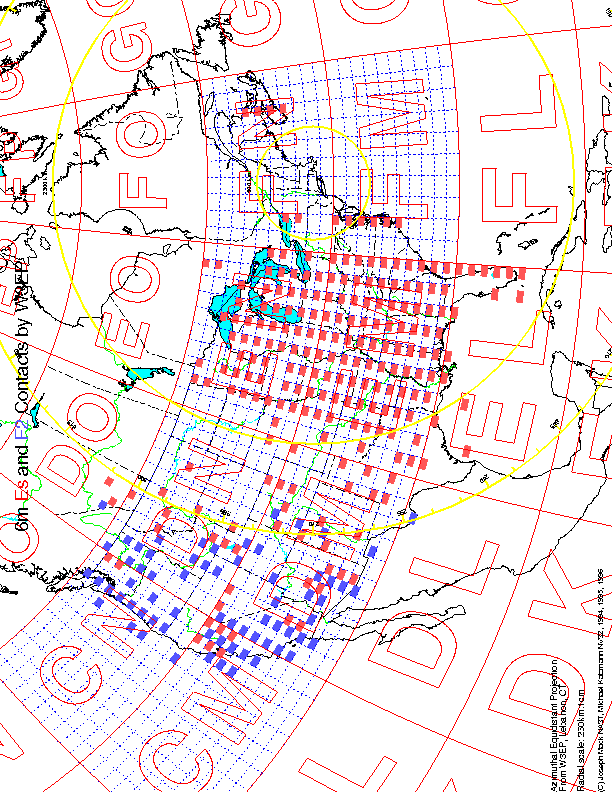
Worked grids can be colored by propagation mode (Es, F2, EME, Au, MS).
The 6m contacts by W3EP
(image of 49,295 bytes)
includes distance lines at 500km (the shortest distance for Es, requires
an MUF of 144MHz), 2300km (the max distance for one hop Es) and
3100km (the shortest distance for an F2 hop).
The 2m grid map
(image of 51,542 bytes)
by HB9DBM
shows 406 grids and 72 DXCC's. Es is blue,
Meteor Scatter is red, Tropo
is yellow, EME is green and
Aurora is hatched.
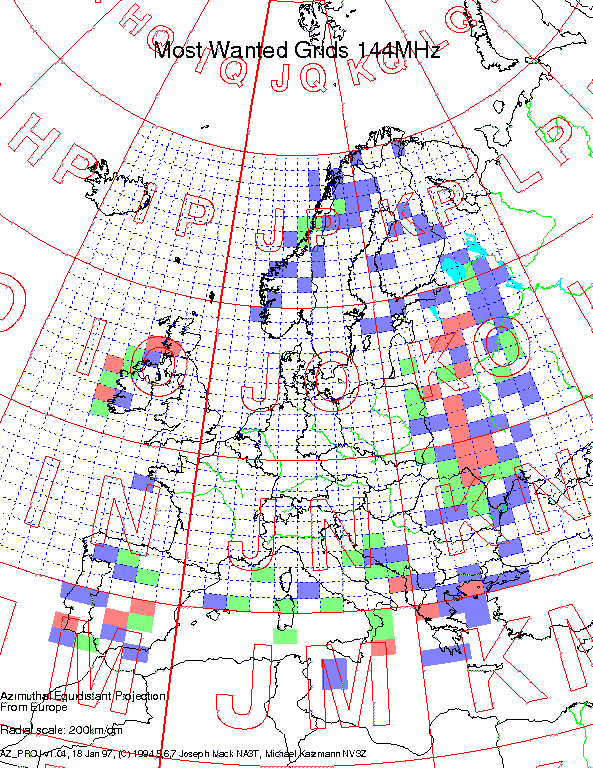
The list of
most wanted 2m grids in DL land for 1996
(image of 46,114 bytes)
assembled by
Guido DL8EBW
doesn't need the azimuthal equidistant projection, but can plot
grids conveniently (the grids are wanted in the order
red>green>blue).
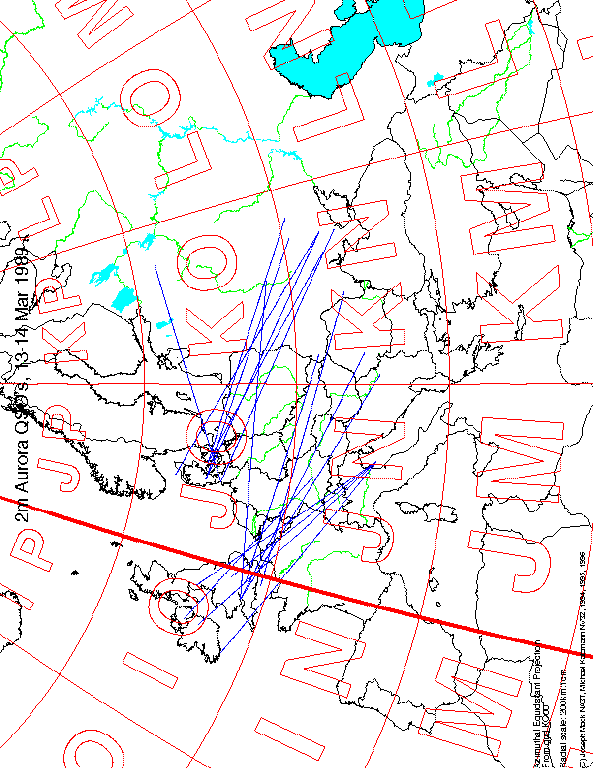
The curved great circle paths between two stations can be plotted for
a band opening, e.g. the
Auroral 2m contacts of 13-14 Mar 89
(image of 35,122 bytes)
(data taken from Radio Auroras, Charlie Newton, RSGB Pub, 1991).
(The curvature is small on the short paths shown in this image.)
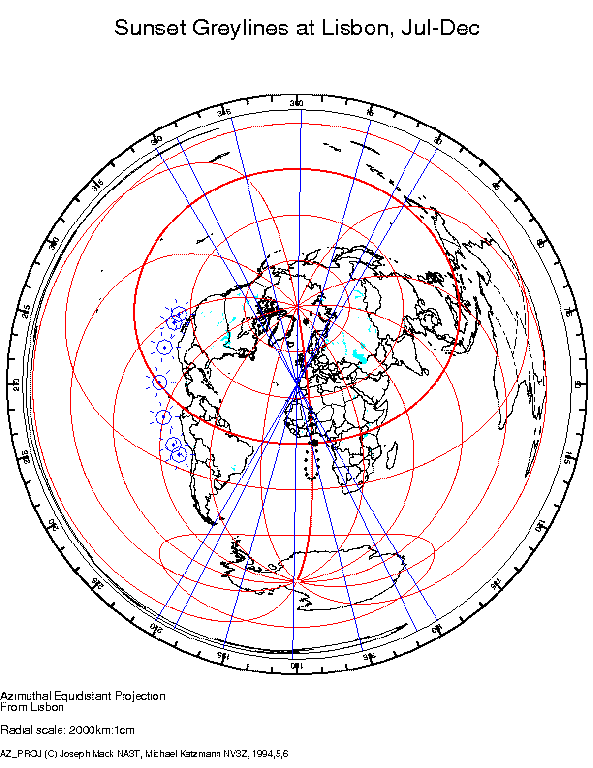
The greyline can be plotted for sunset
or sunrise for any date. A series of these greylines can
be used to determine optimal dates to make a greyline contact
from your QTH to another location.
The sunset greylines at Lisbon
(image of 28,330bytes)
shows the greyline at the 22nd of each month, the analemma and the
positions of the sun at sunset throughout the year. The recent (Jan 97)
Heard Is. expedition drew a map like this
map
(image of 34,979 bytes).
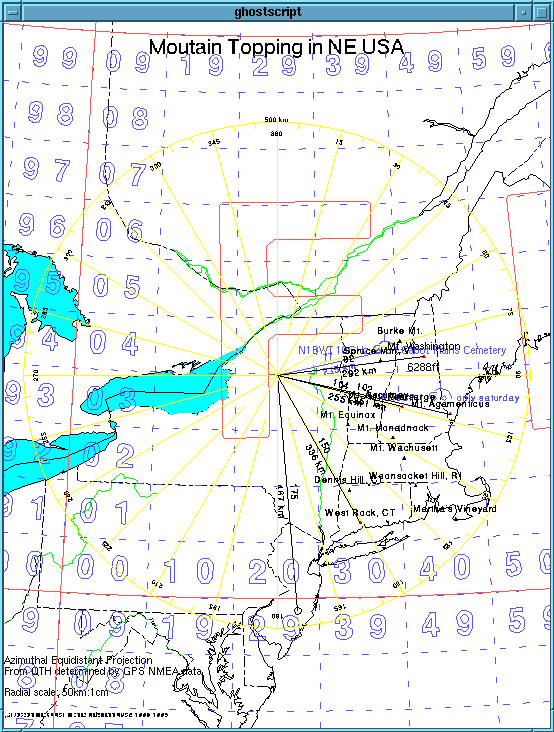
Small scale maps can be drawn using a list of mountain tops for
10Ghz rovers
(image of 24,434bytes).
NMEA data from GPS receivers can be used to center the map for
calculation of bearings on your laptop computer at the site.
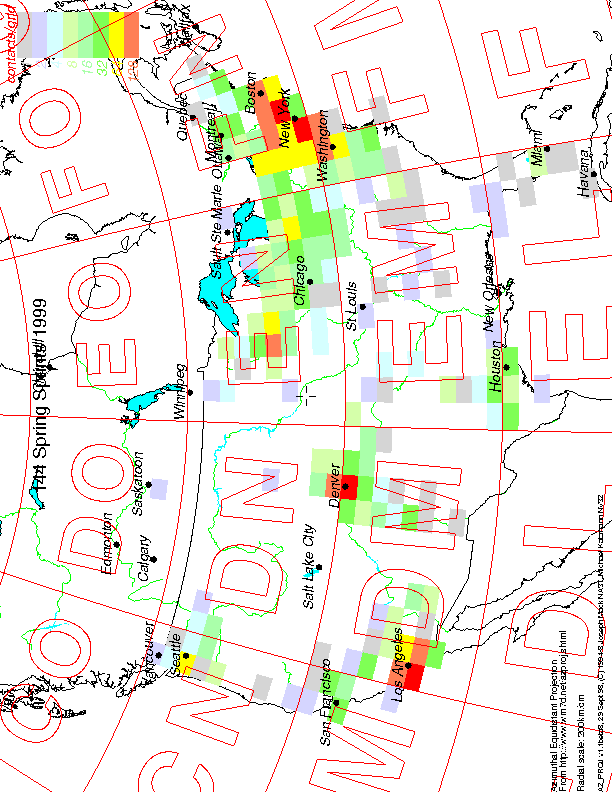
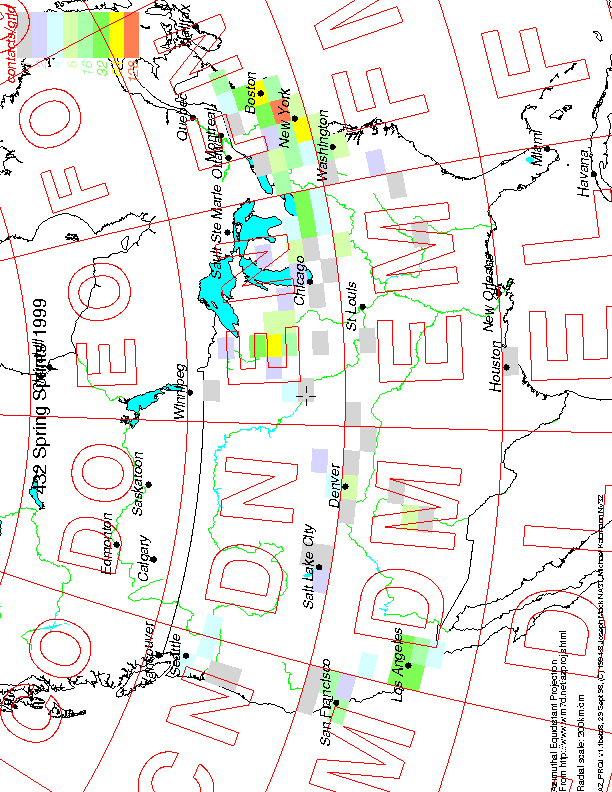
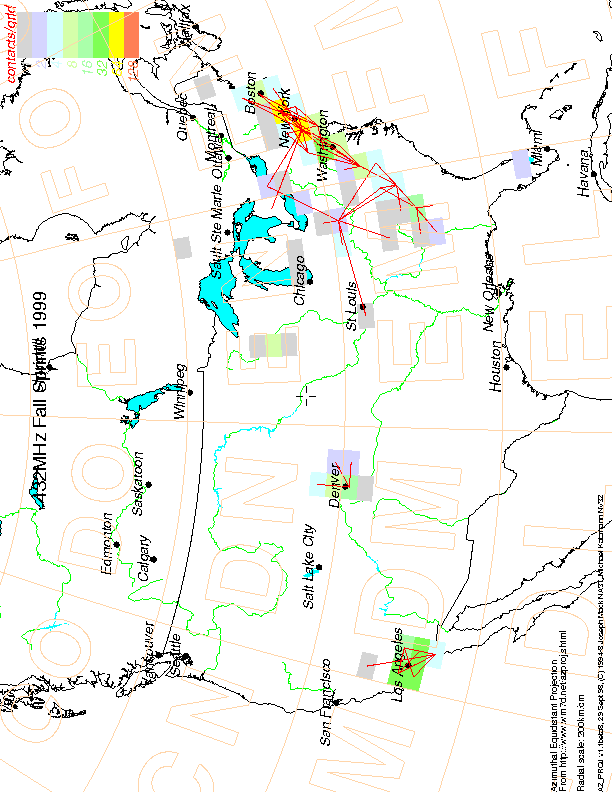
Here are the activated grid maps for 6m, 2m and 432 for the 1999 Spring Sprints.
The contact count for 6m is low, because this was conducted the same weekend as
the Dayton Ham fest. Data is from Wayne N0POH.
Grid Squares and Lat/Lon lines
Grid Squares describe a location on the earth's surface
based on lat/lon. This system is useful for aiming antennas and as
an exchange in contests. The grid locator can be 2,4 or 6 characters.
The biggest "squares" (fields) are 10° of latitude and 20°
of longitude. They are labled with a letter for each (the
"letter" squares, eg FM for the Mid Atlantic region of USA).
The middle sized squares (grid squares) are 1/10th the size and are designated by
numbers (the "number" squares, eg FM19 for Washington DC).
The baby sized squares are 1/24th the size again and get you to within
a few km of your location.
HF operators make contacts over distances too large for gridsquares
to be useful on a map. In this case, grid squares make a very crowded map and
the normal latitude/longitude lines are more appropriate. The server code
defaults to lat/lon spacing of 30°.
Geographical Features
Elevation Data
plotting your gridsquares
At 45deg latitude a 5minx5min box is 8km N-S and 5.6km E-W. Isolated peaks (monadnocks) such
as are used by microwave people in N.E. USA will be averaged out over this size box. (The average height
of a pyramid or cone is h/3.)
Peaks on ridges will be visible though.
Rivers, Lakes
You can turn lakes,rivers off/on. What you want will depend on the
scale of the map. If you are displaying the whole world, the map will be
crowded and you might want to turn off the less important features.
For whole world maps I usually also turn off the states/provinces.Paper Size
Most of these do something sensible on a normal sized
printer (at least for the HP550C inkjet printer I have).
Please let me know if other printers behave weirdly. Greyline
The Greyline is the line of day/night on the earth's surface. Enhanced
propagation occurs along this line in the lower HF bands (160m and to a lesser
extent 80m). The location
of this line varies not only for the time of day, but throughout the year
as the sun goes from the northern to the southern hemisphere.
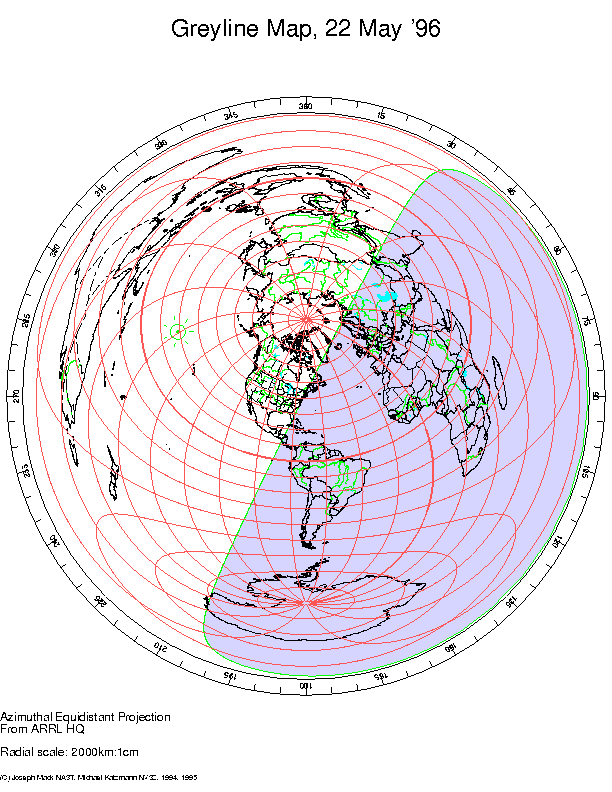
An example greyline map
(image of 35,069 bytes)
is drawn for sunset on the East Coast of USA for 22 may 96.
I haven't figured out how to label the greylines by date, so I've
indicated instead the position of the subsolar point for each greyline (the line from the
subsolar point to the QTH is normal to the greyline).
bugs
when the wm7d server was a solaris machine, one user making a 24hr set
of maps for a contest found that while all of the gifs had the night correctly
shaded, for one 12hr stretch of the png files, the day was shaded rather than
the night. I confirmed this in his output, but could not reproduce this on
my linux box. By the time I got round to looking at the problem, the wm7d
server had changed to a linux box and I couldn't reproduce the problem.Analemma
Although the period of the rotation of the earth about its axis is
relatively constant, due to the eccentricity of the earth's orbit,
the time of the day at which the sun appears in the zenith can vary
from 12noon by upto 15minutes either way. The maximun lead and lag
occur about 7 Nov and 7 Feb. For this reason the sunrise/sunset at
the equinox do not occur at exactly 6:00 and 18:00 local mean time
but a few minutes before or after. So in traversing the sky during
the year, not only does the sun trace a north to south and back
path, but it is also going a little east and west. The combined
motions make a figure "8". This path was illustrated by
a multiple exposure photo published in
Scientific American (I think) once, with an exposure taken at
clock noon every 2 weeks over a year by a camera on a fixed mount.
The locus of the subsolar point
of the sun at clock noon on the earth's surface traces a figure
called an analemma. The position of the analemma comes out of the
calculations of the position of the sun needed to calculate sunrise
and sunset positions and I plotted it to be sure I'd done the
calculations correctly. The analemma has nothing to do with
radio propagation or any of the ham radio interests which
this website addresses, but since it was available from the
calculations, I've enabled it as part of the map server.
Compass/Distance Circles
There are two types of distance/bearing markers.
1. An autosizing compass
with radial spokes drawn at the center of the projection, to
determine azimuthal bearings. The diameter of the compass is chosen automatically
to fit into the map, with the largest convenient radius (100,250,1000.. km).
Cities
Major Cities - 100 entries - for world/whole continent - scale <500km/cm.
An example map from
Berlin at 500km/cm
(image of 36,644bytes).
Population Centers
The
city list
allows you to put names on the map at approximately
uniform density on the surface of the earth.
In contrast, the population list, obtained from the
United Nations Statistics Division
(originally at http://www.un.org/Depts/unsd/demog/ctry.htm
but the link is dead - Oct 2002)
and the
US Gazetter
(follow the link to "Place and Zip code files")
- thanks to Dana Hoggart for telling me about this data
and for the awk script to massage the data) plots cities by population.
The population is spread non-uniformly over the surface of the earth.
AZ_PROJ uses an internal cutoff for plotting population, based on the map scale,
that attempts to fit about the right number of population centers onto a map.
This has the effect that zooming in displays more population centers.
The default cutoff is OK for North America, is too dense
for the Rhine valley or England and is too sparse for Australia.
The cutoff used can be determined from smallest population marker in the legend.
You can then set your own value for the threshold in the form.
Counties (US only so far)
The data is only for US counties and was obtained from the
US Census.
The data file is about the same size as the whole world file (and will take
as long to plot).
To prevent clutter, names of counties are only plotted for
local scale maps (scale < 50km/cm) and counties are not
plotted for maps larger than USA (scale > 200km/cm).
Some of the coastal counties extend further into the sea than
does the coastline in the wdb files. (It must be a way of the
counties getting more taxes.)
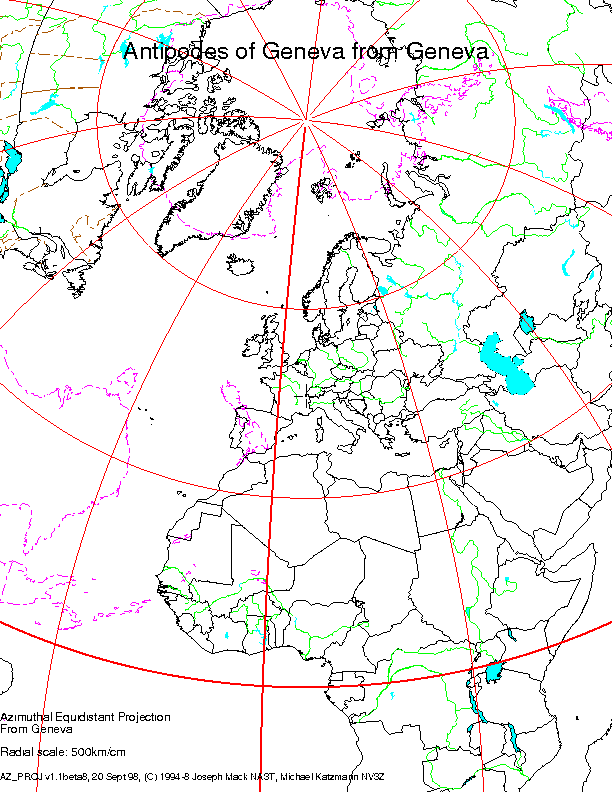
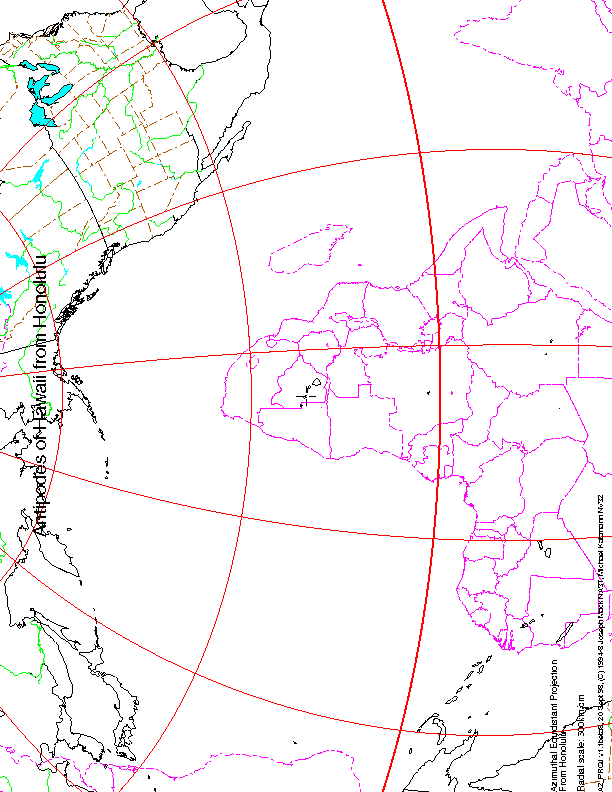
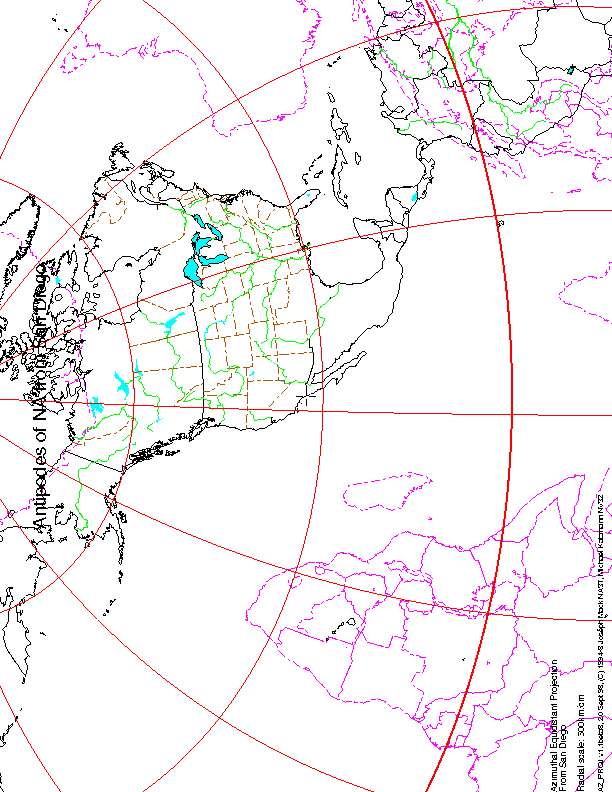
Antipodes
Instead of plotting your QTH as the center of the projection, you
can see what the other side of the world (the antipodes) looks like.
In both cases that whole world is added to the image, drawn in normal mode projected from the selected point.
There are not many land-land antipodean pairs. These maps show why New Zealand is a target for record distance EME attempts.
You might want to turn off the compass if the map appears too crowded for you.
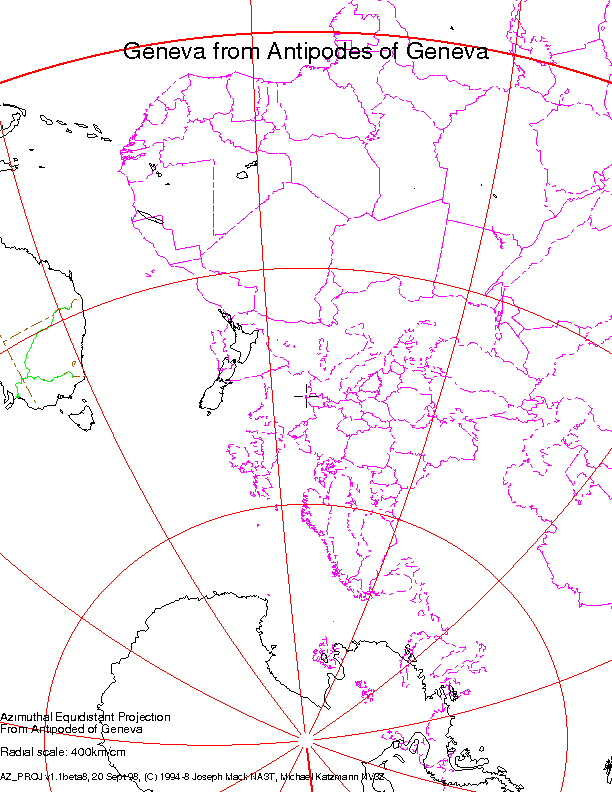
choose the continent antipodean to your continent (here Oceania).
The map will be projected from your QTH, with the selected continent
display in antipodean mode (inverted through the center of the earth). .
A map projected from
Geneva
(image of 37,732bytes) shows
Eurasia in normal mode and the selected continent (here Oceania) superimposed in antipodean mode.
choose your local continent (here Eurasia).
The map will be projected
from the antipodes, and your
continent (Eurasia) will displayed in antipodean mode (inverted through the center of the
earth).
A map projected from the
antipodes of Geneva
(image of 24,534bytes) shows
the antipodes of Geneva (here Oceania) in normal mode and Eurasia superimposed in antipodean mode.
Transmitters, QRA lists, Beacons, TV and Commercial Stations
Beacons
AZ_PROJ has a list of N. American vhf/uhf beacons
and Region 1 6m beacons.
In the downloadable version of AZ_PROJ, this feature can be used
to plot repeaters or high power TV stations used as beacons.
Each beacon symbol displays a circle if the beacon is omnidirectional
or a partial circle
if directional. The number of (partial) circles indicates ERP. Also included
are the callsign and the freq.
Thanks to the efforts of
Colin K4SSO (whose website has disappeared, May 2002)
AZ_PROJ now has a reasonable list of TV and Commercial Broadcast
Stations, including complete lists from USA and Australia and partial
lists from many other areas, including VHF stations for Europe.
The Map Server will plot TV
Stations for North American Channel 2 (55.25MHz),
European VHF (48-62MHz) and Australian VHF (48-86MHz).
The symbol is an unguyed tower with
one section for each power of 10Watts.
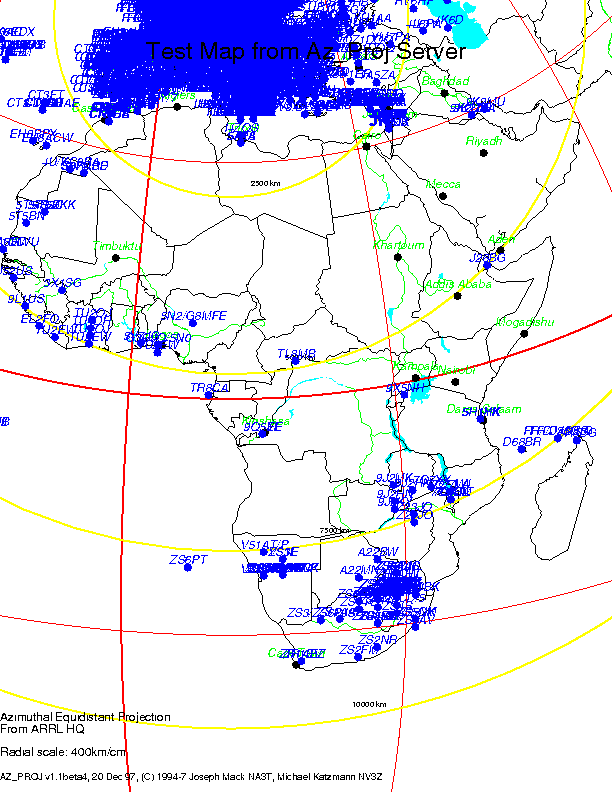
The International 6m QRA list (Jan 98)
contained 7000 call signs (Aug 98, 8000 callsigns) and I was hoping to make maps
showing the location of each OM.
Normally 8000 data points would make for a crowded map.
Unfortunately the situation is worse than this.
The list uses 4 character grid locators and there are many people on
6m in a 4 character grid square.
FN31 has 19 operators and all 19 call signs will be drawn on top of each other.
IO91 has 189 operators.
This list is only useful in places like VK/ZL/Africa where the density of known 6m operators
is low but not zero.
If you send in your 6 character grid locator to
DL4MQD Max (dot) Wild (at) t-online (dot) de,
you will have your own unique spot on this map.
The example uncrowded map of
Africa from Munich
(image of 32,278bytes)
shows what I'd hoped to show.
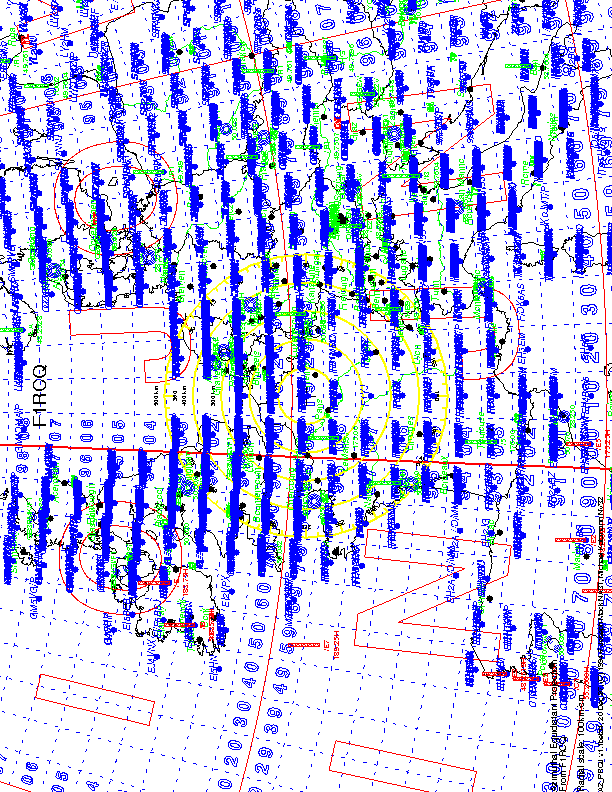
A crowded map of
Europe from F1RGQ
(image of 65,029bytes)
shows what happens if you use 4 character grid locators for your QTH.
Unless you are showing a part of the earth with few 6m operators, you
won't want to use this. Let's wait till everyone sends in their
6char gridsquares.
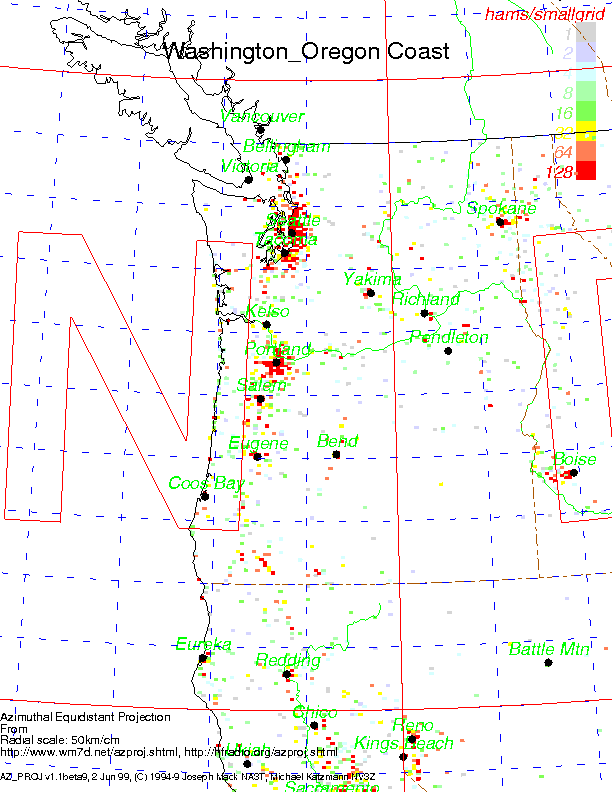
Following the suggestion of Max DL4MQD, the 6m QRA list can be processed
to show the density of operators in any gridsquare. The density is plotted
logarythmically in rainbow order (1 op/square = blue; 128 ops/square = red).
The map has a color/density legend.Most Wanted Grids, Contest and Rover Expedition Planning
I'm looking for logs for VHF/UHF contests. These will help
people plan rover and other DX-peditions. People will be able to make maps according to
contest, band, time of day, to determine where they should be and when. Any contest logs
will be gratefully accepted and treated with confidentiality. People making maps will only
be able to see the number of times a particular gridsquare was worked. They will not
be able to ask for the call signs involved or the gridsquare of the other end of the contact.
My immediate contacts are US stations, so logs will be starting with those people.
Logs for contests outside the US will be very welcome too.
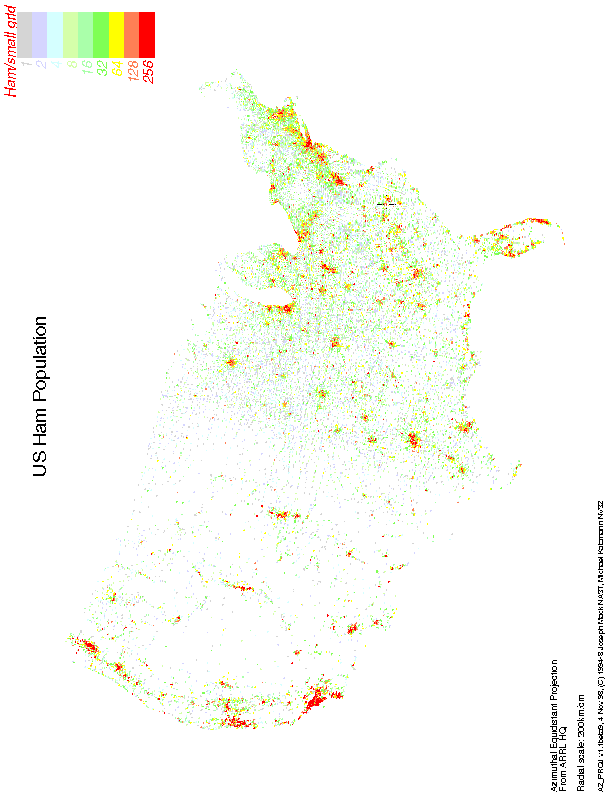
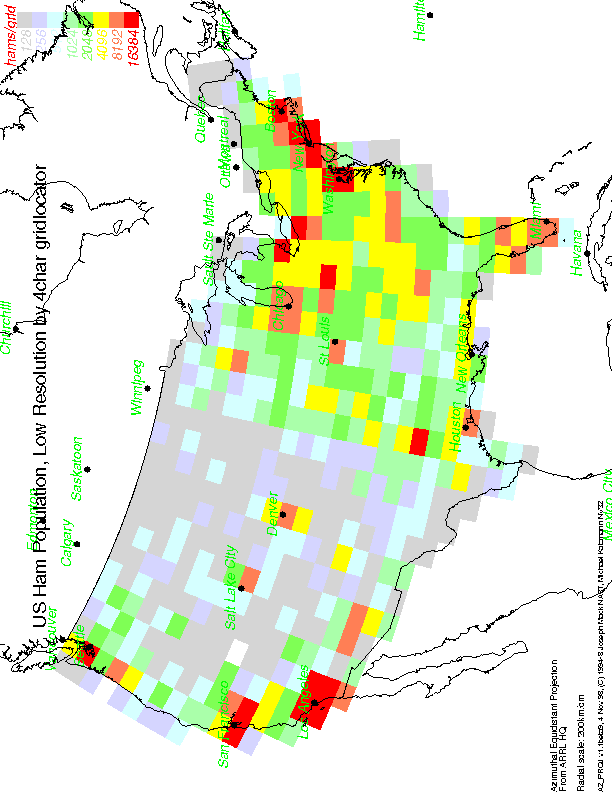
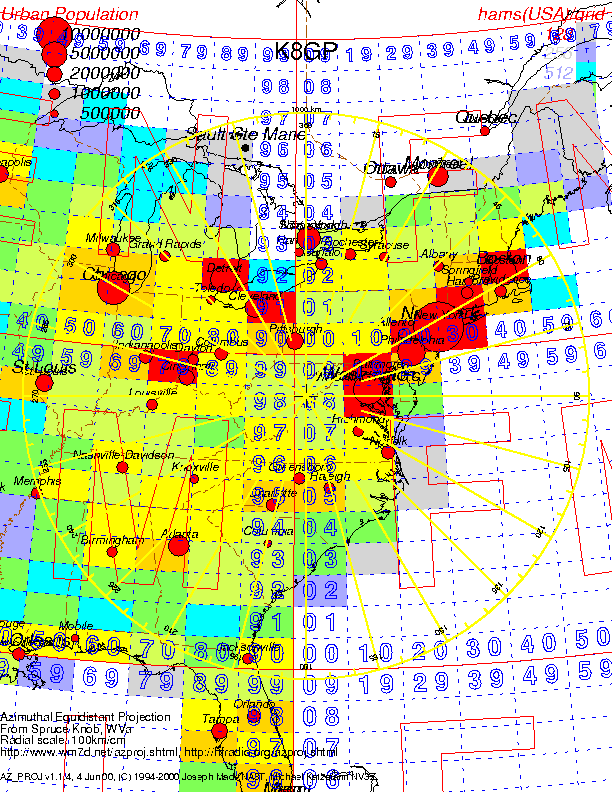
Ham Population Density
You'll get more hams where there are more hams. Countering this, people are less interested
in working you if you are one of many. Here are some ham population maps. They were
constructed by merging the US Post Office list of lat/lon for Post Offices of each zip
code, with WM7D's FCC list of hams/addresses. The high resolution data (6char grid squares)
is sampled in squares about 2x2miles. If no Post Office is in that square, then no hams
will be assigned to that square.
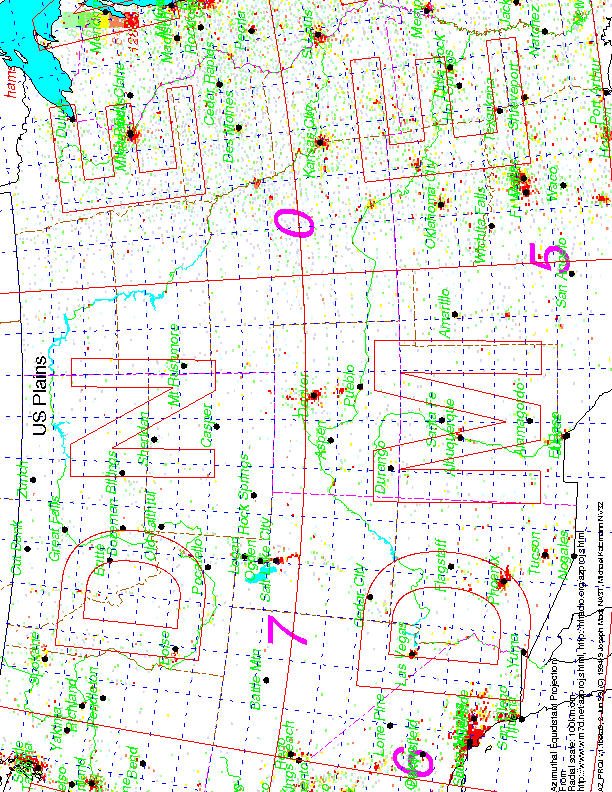
US hams by 6char gridsquares (highresolution)
or
US hams by 4char gridsquares (lowresolution)
(data courtesy wm7d). Note the scales are adjusted for the different size of gridsquares,
so that both maps have the same amount of red. I only have info for USA at the moment.
Elevation Data
Essential information for VHF terrestrial work is the elevation of intermediate points in the qso path.
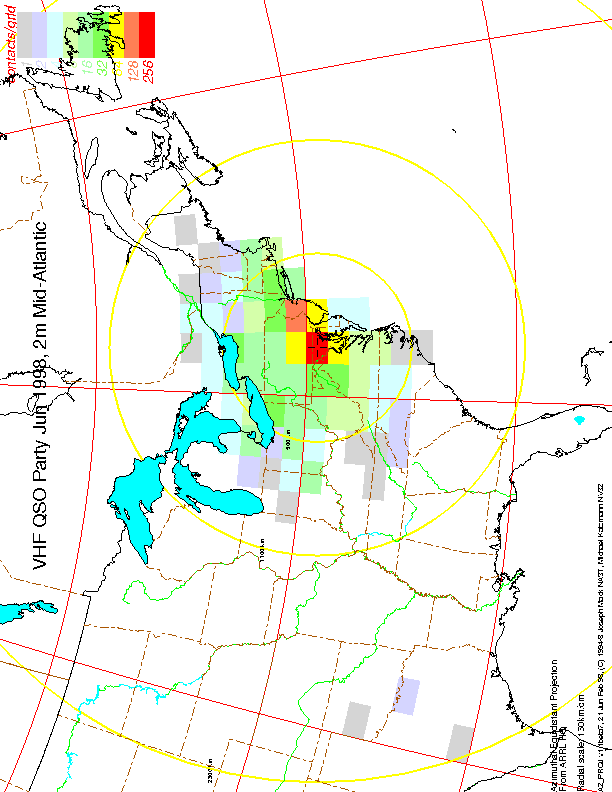
Jun 1998 ARRL VHF QSO Party
I am now canvasing for contest logs and for most wanted lists to put into a database on this server.
The AZ_PROJ server then would be able to generate a map with all the 2m contacts made during
the Summer VHF QSO Party for 1998, or the map of most wanted grids for 1998. I have some logs
from the following contests and have used them to make static maps.Sep 1998 ARRL VHF QSO Party
I'm trying to get a statistically representative sample of the grids that are worked
in any contest.
Please send in your logs or your most-wanted grid list.
I will keep the logs private (they will not be shown to anyone else).
The contacts in your logs will be stored in the AZ_PROJ database
and people browsing will only be able to list contacts
by band, contest and time (eg all contacts in the contest,
or all contacts from 0200-0300 local time).
It will not be possible to list contacts by callsign.
Make sure the log has
Thanks Joe
Islands on the Air, the RSGB IOTA
There's no IOTA list for the AZ_PROJ maps.
The information is copyrighted by the RSGB and they
won't reply to my enquiries about using it.
I contacted Roger immediately about collaborating but received no reply,
then sent this e-mail a year later on 4 August 2001
but haven't received a reply (15 Sep 2001) as yet.
Roger's e-mail address given on the IOTA webpage has not changed in the last year,
so presumably my e-mail is arriving at Roger's computer.
>From eo19 (at) dial (dot) pipex (dot) com Sat Sep 15 04:03:28 2001
Date: Tue, 11 Apr 2000 13:58:30 +0100
From: Roger Balister
The RSGB then wants you to contact them about using their IOTA data,
but they don't reply (hello?, is this communist Russia?).
The information I want is available in downloadable IOTA logging programs
which run on operating systems written by convicted monopolists,
and is used by permission of the RSGB.
Presumably the RSGB replies to some people's e-mails and allows some people
to use the information.
It would appear then that the RSGB,
rather than letting hams do the things they can do best
(assemble such a list for free, which I was prepared to do),
and getting on with the things that individual hams can't do
(act as a representative of the ham radio hobby
to the public and to regulating agencies),
instead has chosen to view hams and their operating activities
as a source of revenue,
by copyrighting freely available information needed for ham radio
and denying its use to hams.
Date: Sat, 4 Aug 2001 04:42:55 -0700 (PDT)
From: Joseph Mack NA3T
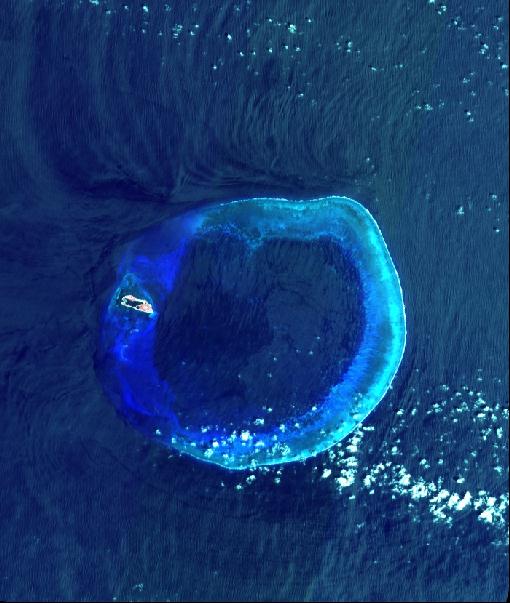
Pratas Is, BV9
My original link to a SPOT2 photo of Pratas Is,
http://www.crisp.nus.edu.sg/~research/research/ocean/coral/coral.html
showed a classic coral atoll with palm trees, green water and coral sand.
The URL is dead, but I recovered the
original photo from
the Wayback machine.
Here's the original writeup
The circular blue band, almost 25km across, is the mostly submerged coral
atoll of Pratas (Dongsha Qundao), China. Waves are breaking around its outer
perimeter. The darker the blue, the deeper the water. The small area in red
is the exposed part of the reef under vegetation with a sandy beach round
most of it. An airstrip is visible. Waves approach the atoll from the east.
and the image information
I had a link to a NASA photo,
which moved following a reorganisation
of the site to enable tracking of image downloads.
NASA needs to justify maintaining the website of free photos.
The new link is at
NASA info about Pratas Is.
and
hi-res info.
The runway is easier to see in these photos.
Machine Readable Lists for Beacons, Repeaters,
Islands, DXCC countries, Mountain Tops, QRA lists and TV Stations
There are no Machine Readable Beacon Lists
freq
call_sign
grid_locator (4 or 6 char, with 6 char preferred otherwise many entries will be superimposed)
power
direction of antenna (-1 for omni, 0 for pointing north, 90,270 for E-W bidirectional)
last_date_known_to_be_valid (ISO format)
authority_for_entry
;comment_field
Marek OK1TRM
Marek can be contacted
ok1trm (at) yahoo (dot) com at home (hopefully long term),
at work mrottenborn (at) con (dot) ln (dot) skoda (dot) cz
(as long as they don't change their domain name)
or possibly
at an alternate work address, mrottenborn (at) ego (dot) ln (dot) skoda (dot) cz
About Joe NA3T
I was first licensed as a ham radio operator at 16 in 1964 as VK2ZJM.
My main interests are building and designing
the electronics and in VHF contesting. My first 432 EME contact
was with 4x5wl yagis I designed using the antenna modelling program
YagiOpt and which I built myself using a mill and lathe.
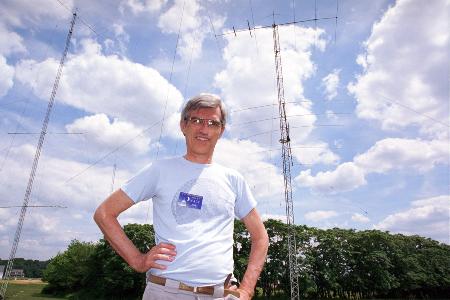
Here I am
at the AGM of the Potomac Valley RC in MD,
1999 infront of some of the antennas at W3LPL.
I'm a member of the
NC chapter of PVRC.
Example AZ_PROJ Maps
Sample AZ_PROJ maps
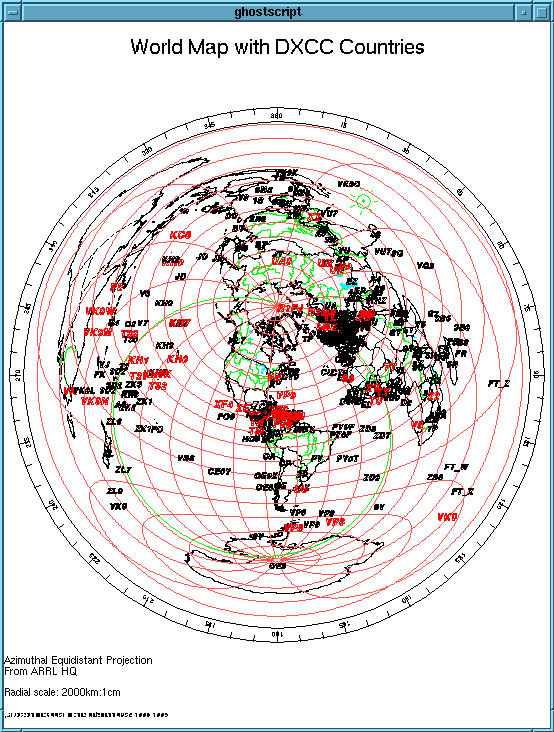
The
world map
(image of 29,905bytes)
is a familiar use of this projection. The labels for DXCC countries
can be given 2 different colors, if for instance, you want to differentiate
those countries you have and have not contacted.
(North American, VHF) Sprints, Activated Grids
Feel free to download these maps. Please give credit to the Sprint organiser(s)
and to this site. The contests are called the Spring and Fall Sprints. Spring 1999
I have not plotted selfs (ie qso's where both ends are in the same gridsquare).
qso's are assymetric, ie if I get only one qso from em19 to en50, then only en50 is recorded as activated. Originally I expected to only get the gridsquare at the other end of the contact but I'm delighted to find that one of the logging programs gives both gridsquares. In the em19-em50 example, a line for the qso is drawn from em19 (unshaded) to en50 (shaded). Presumably I could change the way I score gridsquares to make use of the new information.
For those who do submit computer logs, it is clear that they don't know what an ascii file is and think that because they can see ascii etters and numbers on their screen, that my computer should be able to read an hqx compressed version of their Mac editor binary file as ascii (ie letters and numbers) too. My only solution to this is to ask for people to include their logs into the BODY of their e-mail, rather than as an attatchment. In this way they'll be able to see the difference between binary and ascii on their screen before sending off the e-mail.
The ISO 14 digit format fits well with databases eg
20000126100130 - 26 Jan 2000, 10:01:30 am
Since this format is hard to read when looking at your logs,
20000126:100130 or 20000126::10:01:30 would be OK with me.
If you don't want to include seconds, make them 00.
On upgrading from Netscape v3 to Netscape v4, I found that the colors in the sample maps had changed. For instance the nighttime areas in the animated globes were grey rather than lightblue, and the red squares in the "Most Wanted Grids" map are brown. After some exploration The problem is that I'm using a video card with 1M of memory (the problem is cured with 2M). Netscape v4 has all those nicely shaded button icons and it is apparently more important to have those correctly represented than to get correctly colored images over the net.
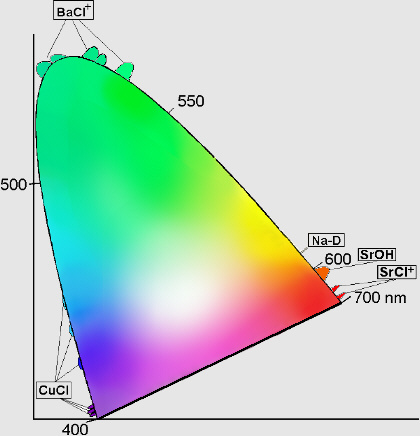
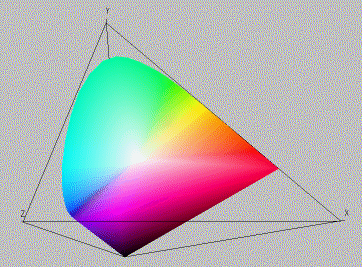
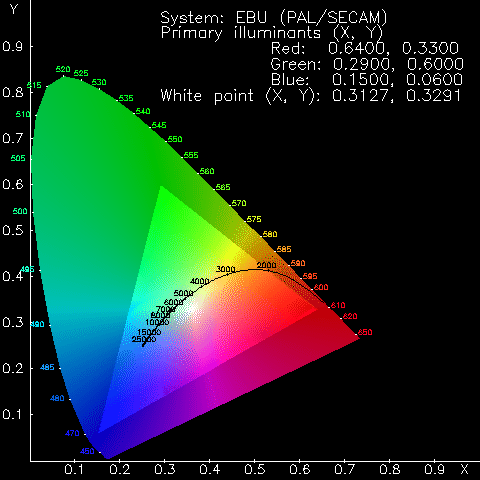
To check how well you can display colors, look at the 24bit CIE diagram (jpeg of 44,523bytes), which has perfectly smooth color gradations. If you see bands or grey regions, then your video card is using those colors already. The 8 bit CIE diagram (image of 48,934bytes, only 256 colors) will show a dark band at 590nm, extending across the white/red border, through to the blue. An alternate 8 bit CIE Chromaticity System (image of 34,567bytes) which I swiped from The Color Space Website (which no longer exists), shows some banding (in the yellow/red and in the red/black region). Here's another 8-bit color diagram with temperature.
The only 2 easy solutions are to get a video card with more memory or shutdown applications that are displaying colors on your screen.
The load on the machine when running the server isn't great Maps only take seconds on GHz machines. The wm7d server draws about 30 maps a day. The code needs perl, ghostscript, netpbm, rsync, apache and several GB of disk space. I would need a shell account with e-mail. I will monitor the map generator and download the maps for inspection (usually daily). I would greatly prefer to run under Linux.
Thanks Joe NA3T jmack (at) trilug (dot) org
 14 Feb 2000:
We made it!
Thanks to our code wizards and the warning of those in congress who held everyone's feet to the fire, we sailed through the time warp of the New Millenium without a hitch. I was out of the country at the time, in Sydney, only 2 hours behind the Y2K tidal wave at the International Date Line and returned to find everything working perfectly.
The new challenge of the millenium is of course the well known leap second bug. Every now and then, to adjust for the slowing down of the earth's rotation, a second is added to time and a minute will have 61 seconds. If you are navigating a Jumbo Jet or transferring money in the bank, the computer will tell you that the time is xx:xx:58,59 and then instead of going to xx:xx+1:00, the computer will tell you that the time is xx:xx:60. This only happens now and again (list of leap seconds), but unlike the Y2K bug, where the effects are obvious and will continue till fiixed (the computer thinks a 90yr old is -10yrs old), with the leap second bug, everything will appear to be normal right now, but for some reason, we didn't know where the jumbo jet was or your money was withdrawn from one account, but never appeared in the other. (I'm sorry Sir, all the rest of the banking was fine today, are you sure you haven't made a mistake).
We're working on making AZ_PROJ leap second compliant. We hope to be the first leap second compliant ham radio website.
8 Jan 98:
We are now Year 2000 Compliant
Thanks to the efforts of Congress, everyone is now aware that on the morning of 2000:01:01, we'll all awake to cold houses, cold coffee makers, defunct traffic lights and when you get to work (if your car will start), you won't be able to let yourself in into a building whose locks, elevators, heating and phones have ceased to work. You won't be able to even fill in your taxes.
 If you think I'm making this up, then this cartoon
(originally on the now -Oct 00- defunct
webpage at http://www.y2kanswers.com/,
a company who is providing Y2K information as a public service)
shows what the improvident should expect on 20000101:0000.
Here in AZ_PROJ land, our code wizards have been working
day and night, scanning the code line by line and our testers in a clean room
isolated from the internet have been torture testing every combination of input.
You can now rest assured that on the morning of Jan 1, 2000, you will still be able
to make an AZ_PROJ map even if you're sitting in the dark.
This makes AZ_PROJ one of the first (8 Jan 98), if not THE first, ham radio web site
to be Y2K compliant.
We have anticipated problems with 2038 though (the well known y2.038k problem)
and will announce our fixes to AZ_PROJ by mid 1937.
If you think I'm making this up, then this cartoon
(originally on the now -Oct 00- defunct
webpage at http://www.y2kanswers.com/,
a company who is providing Y2K information as a public service)
shows what the improvident should expect on 20000101:0000.
Here in AZ_PROJ land, our code wizards have been working
day and night, scanning the code line by line and our testers in a clean room
isolated from the internet have been torture testing every combination of input.
You can now rest assured that on the morning of Jan 1, 2000, you will still be able
to make an AZ_PROJ map even if you're sitting in the dark.
This makes AZ_PROJ one of the first (8 Jan 98), if not THE first, ham radio web site
to be Y2K compliant.
We have anticipated problems with 2038 though (the well known y2.038k problem)
and will announce our fixes to AZ_PROJ by mid 1937.
Latest update, 19 Oct 98: The President of the United States has a signed a bill authorizing the official US Y2K (TM) logo only 9 months after we produced ours. (Oct 00, the logo, originally at http://www.y2k.gov/imagefiles/default.htm, has been removed. Those wishing to see this historic piece of internet art restored to its rightful place should join with me in writing to their congressperson. Our Y2K logo, above, is still available for those that need one.)
Maps may be inspected for errors in the map generation and to look for the features people use. About 80% of the maps require only a change of center and scale, from which was developed the short_form.
We look at the logs when the map generator crashes (e.g. when installing a new version of the code) or when moving to a new site. In the latter case we mail people with links to our site(s) to let them know we're moving. We are too busy to do anything else with the logs, they get rolled over usually in 4 days. We don't give away information about people who use the AZ_PROJ sites to anyone. (No-one has even asked us.)
1.1.6 beta4: bugfix: thanks to WN7T. Long form didn't generate compasses.
1.1.6 Fixed plotting of names of multiple transmitters at one site.
Are all listed under each other now (thanks to W1QA for prompting here).
Added US counties.
Thanks to the US Census and discussions with Pete KS4XG of PVRCNC for prompting this.
The Oct '97 versions of K4SSO's transmitter and broadcast station databases are included in AZ_PROJv1.1.
Oct 2017: New e-mail address.
Joe NA3T jmack (at) trilug (dot) org
Over the last couple of years, I've been using my e-mail account on wm7d.net and austintek.com (the same machine). However the server has been able to send and accept e-mails from progressively fewer machines. I have no control over the e-mail on this machine. Currently only about 1/4 of the people I regularly e-mail can get to me through the az_proj map server machine. Since the problem has been slowly incremental, I haven't noticed it creeping up on me. I probably only get one e-mail every 5 years about the map server, so I've not thought about e-mails for the map server much. I'm sorry if you've been trying to get through to me by e-mail and have failed.
I'm happy for any suggestions.
If you have problems, send me e-mail. Make sure you can make one of the default maps (just hit the SUBMIT botton on either the short or long form). (If you can't do this, the server is having problems and I should know from the logs, but one time I missed the server being down, so still let me know.)
I must have the map number (a 10 digit number). I don't need the parameters you fed into the map (e.g scale, QTH); I can recover these from files on the server, using the map number, and rerun the map with your parameters. (Well how about one piece of info incase the number is wrong? the title of your map.)
If you can make a map, but it's not what you expect
If you didn't get a map, you probably entered data that's out of range.
North Carolina Phonetics

Here is the Official North Carolina phonetics list, supplied by
Alan K4PB (harp (at) bnr (dot) ca, Alan Harp). Bring it with you when you visit.


 	A Are, Ate		N Nine
 	B Bee 			O Owe, One
 	C Cite 			P Pseudonym
 	D Double-U 		Q Queue
 	E Eye, Ewe, Eight 	R Rap
 	F Four, Five 		S Sea, Six, Seven
 	G Genre 		T Tsunami, Two, Three, Tzar
	H Hoe 			U Understand
	I I 			V Vie
	J Junta 		W Why
	K Knot 			X Xylophone
	L Lye 			Y You
	M Me 			Z Zero
Fleaspeak - the vernacular of hamfest fleamarkets

This was passed to me by a friend Apparently it originated in the boatanchors
netsgroup and is due to W8ZR, K9CH, W9GR, WB4MNF and probably others who I
haven't acknowledged

Fleaspeak                                               English Translation

This rig puts out a BIG signal                             It's 50 kHz wide
This is a really good CW rig                         It doesn't work on SSB
This is a really good SSB rig                         It doesn't work on CW
This is a really good rig                      It doesn't work on CW or SSB
The transmitter is outstanding                           It doesn't receive
The receiver is really hot                              It doesn't transmit
This rig is really hot                                          It's stolen
It seems to be a vintage regenerative type                    It oscillates
I just retubed it                 Got 'em from questionable used tube stock
I just aligned it                  The slugs on the transformers are jammed
I don't know if it works                it doesn't work, probably never has
It doesn't chirp               it doesn't chirp because it doesn't transmit
The audio sounds great              The 120Hz buzz is faithfully reproduced
I just had it serviced                  I sprayed WD-40 over all the wiring
It comes with  the original box             Just brush out the kitty litter
Better buy it now, cause it won't last                 no transation needed
Sure, it works at full power              It sucks all it can from the wall
This rig has wide frequency coverage  It drifts up and down and out of band
Frequency stability is great
                         The VFO doesn't work - you'll have to use crystals
Real popular rig in its day
            There were whole HF nets on the repair and maintenance problems
QST gave this one a really great review
                                The language broke new ground for profanity
It might need a bit of tweaking
                        Marconi himself couldn't fix it, much less align it
It was used in government service It was stored outdoors on a wooden pallet
The dial drive may need lubricating
                            the gears are stripped and the setscrews frozen
I plugged it in to check that it lights up
                               The light came from the two foot high flames
I'm selling it because I have two of them
                                          I'm getting rid of my parts radio
You won't find one at a better price
                                Better from the point of view of the seller
This is a collector's item
           the manufacturer just went belly up and won't honor the warranty
It came from an estate sale
                          If you have any problem take it up with the owner
I had it on the air just last night
                                    And you thought the woodpecker was gone
It worked last time I used it      if it still worked I'd still be using it
The only lightning damage was a fuse
                          The only lightning damage I recognized was a fuse
I have the [] somewhere I'll send it to you
                                                    you'll never see the []
I'll help you carry it to the car
                                I'll do anything to unload this boat anchor
It works ok on 80 meters                             It had some parasitics
          but I got in and really screwed it up and now I want to unload it
The tubes used by this rig are worth the asking price
                          The rig uses a rare 7360 beam deflection tube for
a balanced modulator, but it's blown and you'll spend \$80 to get a new one
This is the rig of my dreams I really wanted one of these as a
kid, but now  I've got to let it go
                 As I've gotten older, I've learned what a hunka junk it is
The signal quality of this rig was easily recognizable in its day
              The high distortion and bad audio quickly identified this rig
This rig will bring back the feelings and atmosphere of vintage ham gear
     The bypass capacitors to the AC line put enough voltage on the chassis
      to give you a shock in the lips through the microphone, and it smokes
so bad when you turn it on that you'll probably start coughing and wheezing
I'd keep this baby, but my wife is making me clean everything out
           I finally got around to giving this thing the proverbial heaveho
There are a couple of other people interested in it
        someone sat on it to tie his shoelaces while walking past the table

You'd better buy it now, because I'm leaving soon
                                                 The previous buyer and his
  brother, Guido, are heading back toward the table and they aren't smiling
Subject: [PVRC] fcc announcement 00-4/1 (fwd)
Date: April 1, 2000

(For people outside the USA, the FCC has announced
new standards (much lower) for ham radio licences.
The notice was sent by one of the head Volunteer
Examiners (VE) in the 3rd call area to the mailing list
for the Potomac Valley Radio Club, a large HF
contesting club centered on Washington DC, USA)

For those of you who don't get the automatic FCC bulletin-forwarding:

FCC has announced that as soon as the new question pools are available
(read April 15) amateur extra class licensees with 1x2 and 1x3 calls
will be randomly selected and given 60 days to appear before an FCC
examiner for a 20 question "mini-test" ... passing grade is 75%.
(This is to "validate" the new pool, and "calibrate" the current
crop of Amateur Extra licensees.)

Those who fail will be given another 60 days to re-examine with a certified
VE, or risk losing their current privileges.

(((note ...  the fact that we have an FCC facility
"in our back yard"  probably adds to the probability
that "local" hams will be the first guinea pigs.)))

Don't say I didn't warn ya'   ...  73/PUD

Pud Reaver, W3YD
from NW7US
NEW AMATEUR RADIO LICENSE EXAM

The new amateur radio test is here.  A few changes have been made.
The new test has been designed so that the same test can be given
for all license classes.  To qualify for the higher classes of
license, all you have to do is score better on the test.  This makes
things so much simpler for VE's.

I have included a copy of the new exam.

====================================================================
Please PRINT (that means no squiggly lines)

    YOUR NAME (what they call you)
    __________________________________________

    ADDRESS (where you live)
    _______________________________________________

    BIRTH DATE (when you were born) ________________________________

EXAM INSTRUCTIONS:

Make a circle (one of these round things O ) around the letter of the
best answer! This is so we know what your answer to the question is!

   1. You TALK into a microphone with your _______.

      A. Hands
      B. Feet
      C. Toes
      D. Mouth
      E. Armpits

   2. When you talk into a microphone, you talk into _______.

      A. the front
      B. the back
      C. the top
      D. the bottom
      E. the wire

    3. "HEADPHONES" are worn over the ___________.

      A. Knees
      B. Eyes
      C. Toes
      D. Ears
      E. Lips

    4. What do you do with the AC line cord coming out of a power
       supply?

      A. Hold it in the air to pick up signals
      B. Pull on it to start the motor
      C. Talk into the plug to get real "skip DX"
      D. Hook it to your antenna
      E. Insert the plug into a source of power

    5. A "two meter" radio is:

      A. twice as strong as a one-meter radio
      B. two one-meter radios in series
      C. a CB with two meters on the front panel
      D. a good doorstop
      E. a monoband radio

    6. A "ten-foot mast" is how long?

      A. Three meters
      B. Ten pounds
      C. Two meters
      D. Tree-top tall
      E. Same length as basketball hoop is high

    7. A "Triband antenna" is made to work on how many bands?

      A. 1
      B. 2
      C. 3
      D. 4
      E. 10

    8. The "Marconi" antenna is named after:

      A. Marconi
      B. Mantovani
      C. macaroni
      D. Dean Martin
      E. martini

    9. What colors of DIODES can you buy at a Radio Shack store?

      A. Red, blue and black
      B. Red, yellow and green
      C. Orange and brown
      D. I am color blind so this is a discriminatory question and
         I should automatically get a waiver on this question.
      E. I have no intention of ever using DIODES, so don't care what
         color they are.

   10. What color of SLURPEE can you buy at 7-11?

      A. Red, blue and black
      B. Red, yellow and green
      C. Orange and brown
      D. I am color blind so this is a discriminatory question and
         I should get another waiver on this question. I now have two
         questions right.
      E. All the above

   11. You have just installed your new mobile rig in your vehicle
       and you are still parked at the curb, you need to pull out
       into traffic and you are talking to another station?

      A.  You put down the mic long enough to signal that you intend
          to pull away from the curb
      B.  You keep on talking and just pull out in traffic
      C.  You open your left rear door to signal that you want to pull
          out in traffic, while calling CQ DX on the repeater
      D.  You install a light bulb at the top of your antenna so that it
          will flash when you are talking on the radio and people will
          then know to let you out

    END OF EXAM.

    YOUR SIGNATURE (slap yo tag here)

    _________________________________________

====================================================================
    SCORING:

    Get FOUR correct and you get an EXTRA!!!!
    Get THREE right and you get an ADVANCED!!!!
    Get TWO right and you get a GENERAL!!!
    Get ONE right and you get a TECHNICIAN!!!
    Get None right. Go back out in parking lot and study another five
        minutes. When you are done, come back in and try again.
You will get this if you're running az_proj from the command line, and you've upgraded to a recent (>2017) version of ghostscript, that's been compiled by an accomplice of the ghostscript developers. The ghostscript developers are removing (or have removed) the device files (e.g. png48.dev, which produces png output) thus breaking every working installation of ghostscript for the last 30 years. I know code that just gets written and doesn't need to be maintained is anathema to most of the computer world. But if the developers are going to gratuitously break their code, which you use for your application, there's only so much code you can maintain. I wrote AZ_PROJ in Postscript, a defined language, so that I would not have to spend the rest of my life maintaining AZ_PROJ. However it seems that developers have more important goals, than keeping systems running.
Joe's maxim: never upgrade a working machine (it can't get any better, it can only get worse).
My cure is to compile the code yourself to make a version of ghostscript that has the .dev files. I'm using ghoststript-9.18 (Keep ahold of your working version; the .dev files are going away in the newer versions.) It also seems that you can't download older versions of ghostscript anymore, so hang onto your old source code files, really! At the moment you can get ghostscript-9.18.tar.gz from Building Linux from Scratch and Artifex's Github repository
This produces all the .dev files and works with the commands I've given.

root# cd /src/(wherever)/ghostscript-9.18/
root# mkdir objdir
root# cd objdir
root# ../configure --prefix=/usr
root# make

assuming successful completion, look for the .dev files. Here are the png files

root# find ./ | grep \\.dev | grep png
./obj/pngmono.dev
./obj/pngp.dev
./obj/libpng_0.dev
./obj/png48.dev
./obj/png16.dev
./obj/fpng.dev
./obj/png256.dev
./obj/pnggray.dev
./obj/png16m.dev
./obj/pngalpha.dev
./obj/libpng.dev

then do

root# make install
I expect the developers want you to figure out how to run their new, bright and shiny ghostscript. I won't be doing it. I have a life. If you figure it out and test it to death, I'll gladly put your instructions here and credit you.
AZ_PROJ was released 30 Jul 1994
The main reason I started the project with NV3Z, was to have maps for VHF contests. I needed to mark gridsquares as I worked them and to know the beam azimuth. I had found that bearings from Maryland to Connecticut, only a few 100km away, calculated on a Mercator projection map, were consistently off by more than the beamwidth.
The code was started as a winter project in about Jan 1994 and
took a temporary break while I watched the winter Olympics.
I estimated that it would take about 3 weeks to write the code.
It did take about 3 weeks to write the lat/lon to
az/el transformations and a few other core routines,
but getting useful code would take about 6months.
NV3Z had lots of ideas in this direction
and understood how to send data
(
The first problem was finding formulae for converting the lat/lon of a point on the earth into distance/bearing from your location. The formulae available in the books I found (all introductory or for young people), required you to know the octant at each end and to look up a table to add or subtract the partial results. Presumably this method is from the age of square riggers and trig functions with arguments between 0 and 90deg. Why these difficult and mistake prone methods are still being taught, is beyond me. NV3Z found the routine gc by N5OWK which handled the transform in a few steps using trig functions with the full range arguments.
Of course, I should have been able to remember the formulae from high school. Back then the teachers were busy pruning the each year's syllabus, so they would be left with something to teach us in later years. If left unchecked, we'd cover the whole high school math syllabus in one term. If we asked for more, we'd get "we'll cover that in 3 years time". So spherical trig was overflowed off the end of high school and became forbidden knowledge. The other problem is that I'm not smart enough to derive the equations myself.
As befitting code designed for VHF contesting, NV3Z and I read a paper on AZ_PROJ and released the code (azprj104.zip) at the Central States VHF conference in Memphis in 1994. The code was also posted to one of the early internet ftp download sites. I had expected that people would start making maps straight away and shortly thereafter, I would be deluged with code patches and ideas for neat new features that I hadn't thought of. The ensuing silence showed that I misunderstand my audience.
After the birth of my son, moving to a new job and a new town, about a year later I wrote the map server (the code which generates the code on your screen here) to demonstrate a small subset of the features of AZ_PROJ to the wide world. Now for sure, people would download the code, start making maps at home using all the features, and send me patches and new ideas. The map server came online probably around early 1996, running on my desktop machine at work (the machine name was elvis). Depending on your options, the map took 6-15 mins to generate. After a few announcements to VHF mailing lists, people started connecting to my desktop machine (an SGI, running Irix) and the disk would start to whirr, letting me know that yet another person was making a map.
A problem with running the server on my desktop machine at work, was that the length of employment was shorter than the lifetime of URLs listed on webpages, so in about 1998, after a few job changes, Mark WM7D offered this site as a more permanent home and AZ_PROJ has been here ever since. Mark keeps upgrading his hardware and now a minimal map takes only seconds to generate.
Even though I'd only announced the code to VHF mailing lists, most of the maps being produced were of the whole world, presumably being made by HF operators. I rarely saw a map produced on a scale suitable for VHF operation. As well few people were downloading the code. I would get e-mails asking for features on the map server that were already in the downloadable code. I'd reply that the map server was only a demonstration and that you were supposed to download the code and make the maps using all the available features yourself. After quite a few of these e-mails, I realised that I still misunderstood my audience and started adding the features to the map server that were already in the downloadable code.
For the next 5yrs,
most of my spare time was spent writing new code
(including implementing some ideas from e-mails)
and looking for freely available data to use in the maps.
Although initially not much data was available,
as the internet became more widely used,
more useful data became available.
Much of the data for ham radio either was not freely available
(it was copyrighted and not available to the general ham radio population)
or not useable
I put much effort into analysing contest data and openings, with the idea of seeing what there was to learn from them, only to find that
Few people download the code and run it at home. Although a few people who downloaded the code had no problems running it, most people who tried it do not understand Postscript, or the concept of platform independant computing and have had no end of problems producing maps at home. Clearly I still don't understand my audience.
I'm heartened that something I've produced has proven useful to others. I'm surprised to find that maps are still being produced here day in and day out. With the number of maps that have been run here, I imagine every ham in the world has a large AZ_PROJ map on their wall and there'd be no need for any more. I guess there's always another contest.
There've been no significant changes to the code since 2002; only a couple of bug fixes, thanks to alert users. The code seems to have all the features people want. With the code being platform independant, it should survive the arrival of any number of new devices and platforms. I will be leaving the map server on the internet as long as people use it.
|
|
8 Jan 98:AZ_PROJ is one of the first, if not THE first,
ham radio web site to be Y2K compliant. (Does anyone remember Y2K?
It was very important in case you've already forgotten the lessons we learned.) Feb 2000: I was out of the country for Y2K. When I returned a week later, I found this exciting first AZ_PROJ map of the millenium drawn from the Gulf Coast at 000403am. If this is your map and you want to be celebrated as AZ_PROJ's ham of the millenium, please let us know. We made it through 1 Jan 2001 too, for those who change their oil at xx,001 rather than xx,000 miles/km. |
Joseph Mack NA3T (C) 1995-2003,2010,2011,2017,2019