
|
| |||||||||||
WM7D's Solar Resource PageWednesday, 06-May-2026 10:47:38 GMT
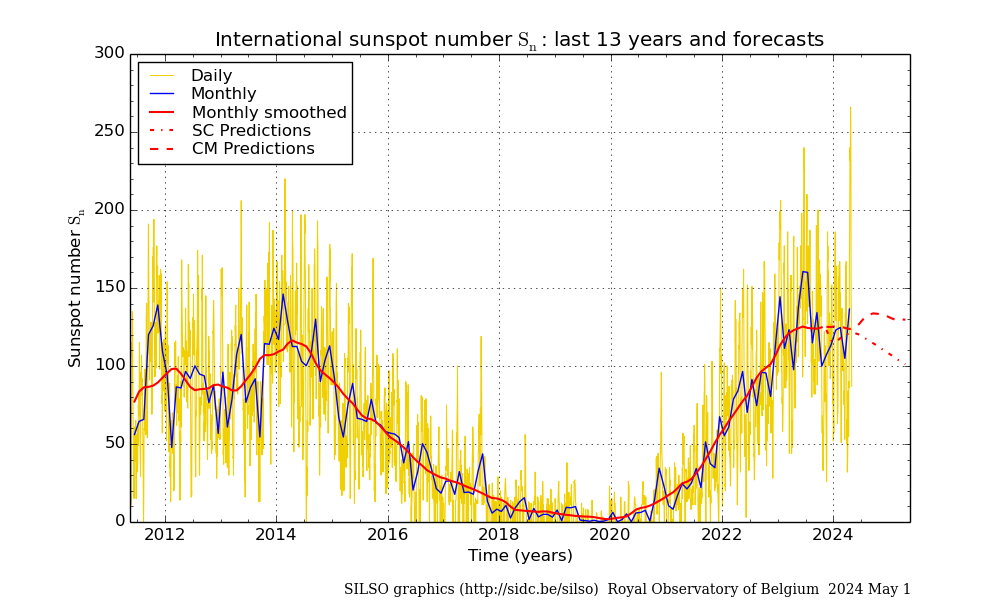
This chart is based on
daily sunspot and solar flux numbers reported by NOAA. It is updated once
per day.
This chart is based on the NOAA Geophysical Alert Message (updated every three hours). Included are the Solar Flux, K-Index, and A-Index numbers for the past six months. This chart is updated every three hours (at 15 minutes past the hour), along with the text report at the top of this page.
For more information about these numbers, and what they mean, see the links at the bottom of this page. | ||||||||||||


|
|